
“All models are wrong, but some are useful.”

-    George E.P. Box
The consensus perception of prevailing central bank orthodoxy is that short-term interest rates govern future economic growth. As a result, the market consensus has continuously forecast an economic recession since the Federal Reserve (Fed) started hiking their short-term policy rate at 75 basis point increments in 2022. While this hasn’t been our view or our portfolio positioning, the Pavlovian response is nonetheless tempting and intuitive. Higher borrowing rates make debt-dependent consumers and business models less sustainable and all else equal should slow the economy down. But is this model grounded in empirical evidence? Spoiler alert – it’s not.
The Background
Jan Hatzius of Goldman Sachs released a paper in 2018 that argued surprises in future economic growth are more closely linked to a broader set of financial conditions. The paper addresses the above question head-on:
The effect of the short-term interest rate on GDP—known as the “IS curve”—is a central relationship in standard macroeconomic models. But we show that the IS curve for the US has broken down empirically over the past few decades…

…the empirical results show that the conventional IS curve has seemingly broken down because the relationship between the funds rate and financial conditions has weakened substantially. It was stable and highly significant until the 1980s or early 1990s but has become insignificant or even wrongly signed since then.1
Hatzius’ work is a statistical analysis of the impact the Fed Funds rate has on the output gap, or the difference between actual gross domestic product (GDP) growth and the economy’s potential growth. Hatzius argues the Fed’s policy rate hasn’t impacted US GDP in the last few decades and that the Goldman Sachs Financial Conditions Index (FCI) is a better predictor.
The FCI is defined as a weighted average of riskless interest rates, the exchange rate, equity valuations and credit spreads, with weights that correspond to the direct impact of each variable on GDP. Hatzius demonstrates that while the Fed’s forward guidance in press conferences has a short-term impact on these components, the linkage between the Fed Funds rate and this broader set of financial conditions has actually broken down.
The Update
Following Hatzius’ research, we’ve used the FCI in our macroeconomic research as one of the barometers for economic outcomes and medium-term capital markets assumptions. It’s actually the first slide in our investment committee presentations on macroeconomic analysis. In this note, we provide an update on the current state of financial conditions and make the case that investors and advisors should pay attention.
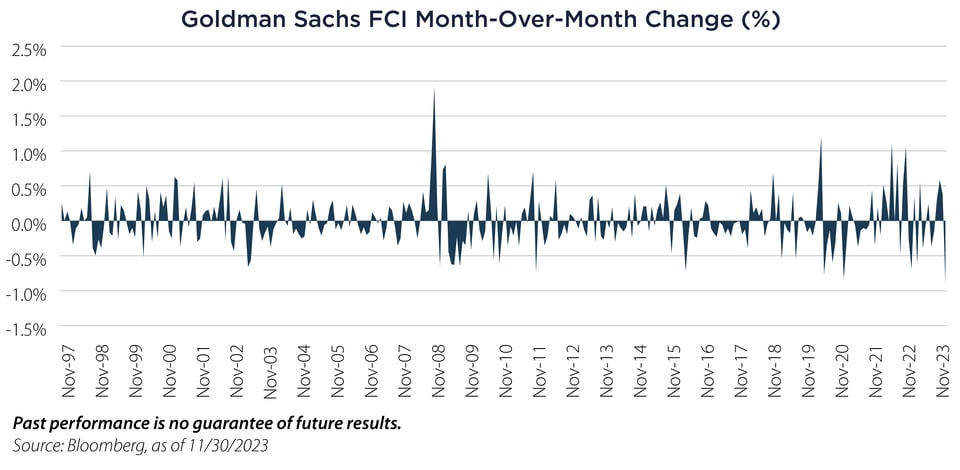
In the below figure we show the monthly change in the FCI since the index’s inception. A negative value indicates an easing of financial conditions, whereas a positive value indicates a tightening of financial conditions. According to the index, last November showed the most significant monthly easing of financial conditions on record.
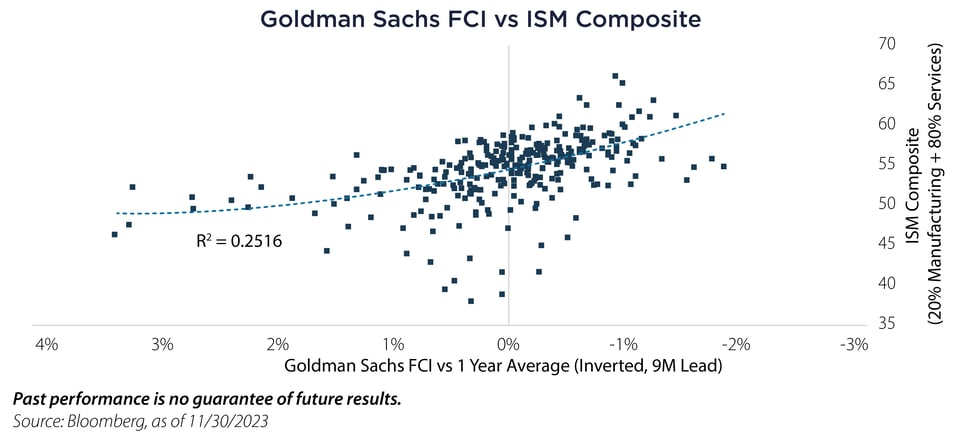
In the next figure, we show the relationship of the FCI relative to its previous one year average with a 9-month lead and a weighted composite of the Institute for Supply Management’s (ISM) Manufacturing and Services Purchasing Manager indices. The latter indices are widely followed leading indicators and reflect a real-time survey of purchasing managers’ outlook for economic growth. Aside from a handful of outlier months, an easing FCI relative to its one year average is generally related to an ISM composite greater than 50 three quarters later, signaling economic expansion.
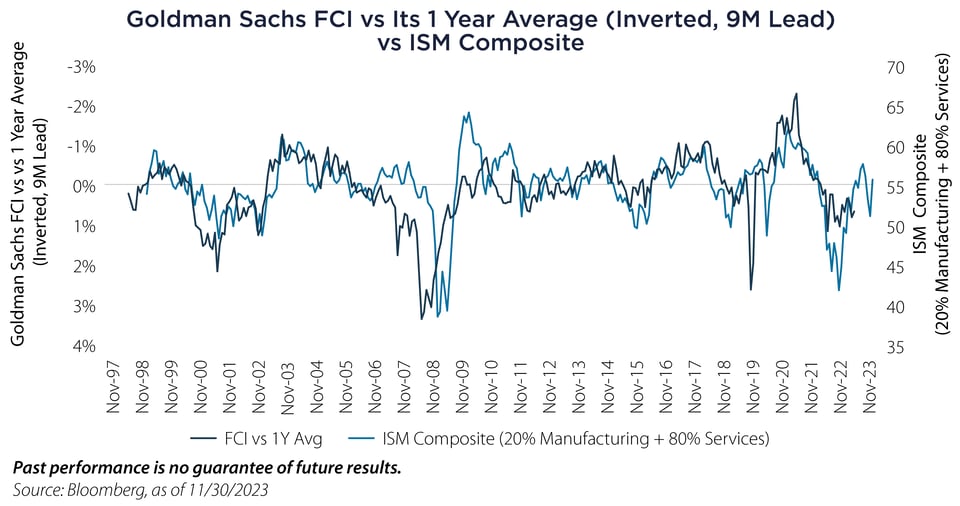
In the last figure, we plot the same exact data in a time-series format so the reader can better understand how the data evolves over time. Following a dramatic tightening of financial conditions in 2022 the FCI is considerably above its one year average, pointing to an ISM composite value of around 54 in the second half of 2024. If correct, consensus economic recession forecasts may well be pushed out again to 2025.
The Implications
No one knows the future with certainty, but with so much capital complacent in cash or short term bonds and a dramatic rebound in risk assets in 2023, we view the next few quarters as having significant potential for continued economic stability and a chase back into risk assets – particularly those that have been left behind by the narrow rally that has thus far characterized equity returns in 2023.
The phrase Don’t Fight the Fed was a popular phrase among traders and asset allocators in the last decade. Underpinned by a critical assumption that the Federal Reserve’s monetary policy was the driving force of risk assets, we view the model as too simplistic. Economies and markets are a complex adaptive system, constantly changing and acclimating to the new set of financial conditions. As Hatzius’ work has shown, we’d advocate a different phrase that lines up more closely with the empirical evidence: Don’t Fight Changing Financial Conditions.
Important Disclosures & Definitions

1 Hatzius, Jan. The Case For A Financial Conditions Index. Goldman Sachs Global Economic Paper, 2018.

Basis Point (bps): a unit that is equal to 1/100th of 1% and is used to denote the change in a financial instrument.

Goldman Sachs Financial Conditions Index: a weighted average of short-term interest rates, long-term interest rates, the trade-weighted dollar, an index of credit spreads and the ratio of equity prices to the 10-year average of earnings per share. One may not invest directly in an index.

ISM Manufacturing PMI: measures the change in production levels across the US Economy from month to month. One may not invest directly in an index.

ISM Services PMI: a composite index based on the diffusion indexes for four service economy indicators with equal weights: Business Activity (seasonally adjusted), New Orders (seasonally adjusted), Employment (seasonally adjusted) and Supplier Deliveries. One may not invest directly in an index.

R-Squared (R2): in investing, R-squared is generally interpreted as the percentage of a fund or security's movements that can be explained by movements in a benchmark index. An R-squared of 100% means that all movements of a security are completely explained by movements in the index.

AAI000527  12/19/2024