During a recent family vacation, as we drove up the east coast of Scotland, we saw several offshore oil rigs which prompted us to think about Energy, which is one of the sectors in the US Equity market that has been left behind so far in 2023. As of this writing, the S&P 500 has returned approximately 17% year to date, while Energy stocks in aggregate are barely above water so far this year.
This performance is not very surprising given that oil prices have been stuck in a $70-$80 range this year, and natural gas prices have been relatively stable since the end of February.
Having said that, we believe investors may want to take a fresh look at the Energy sector for several reasons.
First, Capital Expenditures (CapEx) in the sector remain relatively low. As the chart below shows, inflation adjusted CapEx for producers of oil and gas remains significantly below the 2008-2014 period, suggesting that Energy companies have taken seriously investors’ concerns about over-investment.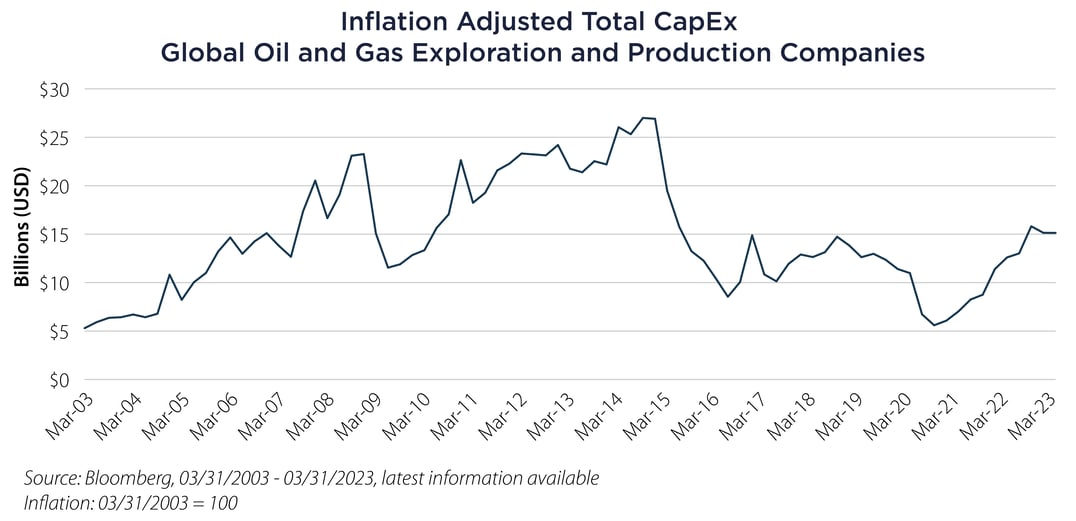 When measured as a percentage of revenue, CapEx is at its lowest point over the past 30 years, at under 8%. By way of comparison, CapEx as a percent of revenue peaked at over 17% in 2014.1 This has driven significant Free Cash Flow Growth.
Second, companies appear to be holding the line on reinvestment and instead returning cash to shareholders through share repurchases and dividends. The chart below shows the average shareholder yield ((dividends + buybacks)/market cap) since 2013. After bouncing between 0-6% for most of the period, this measure has rapidly increased to over 10% currently.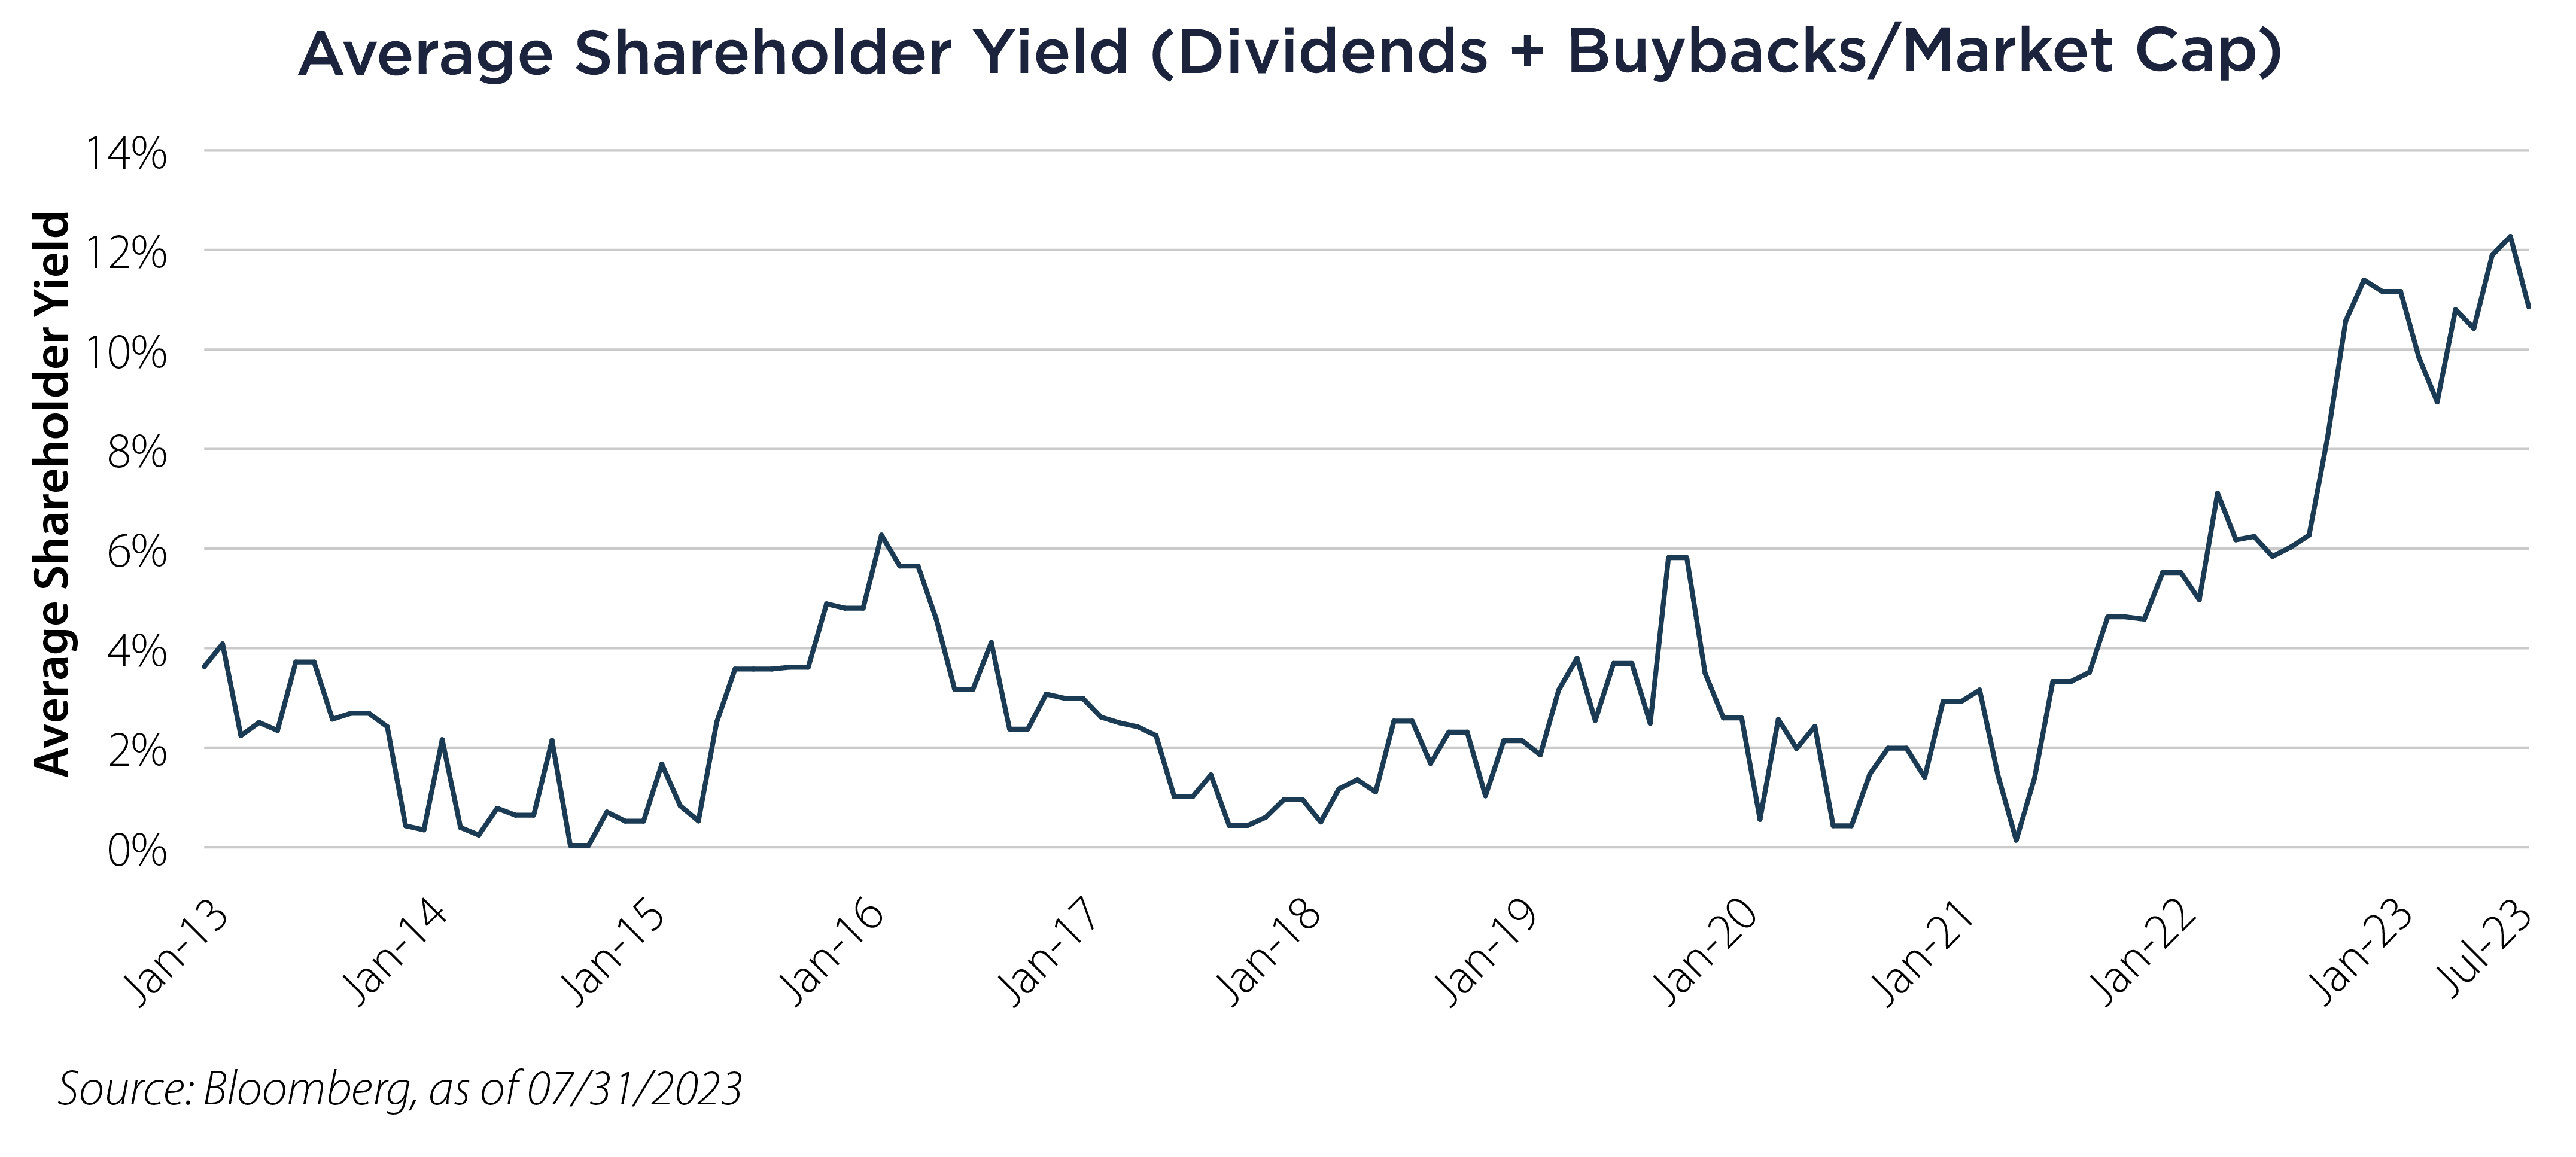
Additionally, several companies have announced commitments to continue to focus cash deployment in the form of shareholder return.
Third, management teams of Energy companies are increasingly being incentivized to focus on profitability and cash flow over growth. Currently, approximately 60% of firms have return on invested capital (ROIC) incentives and over 50% are focused on cash flow. Both have increased as a percentage significantly in recent years. On the other hand, management teams that have growth focused incentive plans has decreased significantly.1
Finally, valuation is not stretched in the Energy sector. As of this writing, the weighted average price/earnings ratio for the sector is just under 12x. This compares favorably to the broad S&P 500, which is currently at 20.5x.2
Portfolio Implications
In recent weeks we have written a few pieces highlighting the importance, in our allocation decisions, of quality. One of the definitions of quality is focus on those decisions that are consistent with wealth creation. The Energy sector, which has long been characterized by boom and bust cycles, has in recent years started to allocate capital in ways that are more consistent with long term value creation. It may be a good time to take a closer look.
Important Disclosures & Definitions

1 Source: Credit Suisse HOLT: Breaking the Capital Cycle – Perspective on This Paradox & Screening for Opportunities, February 3, 2023

2 Source: Bloomberg, as of July 31, 2023

Capital Expenditures (CAPEX/Capex/CapEx): refers to investments in physical assets such as plant and machinery. Numbers sourced from Bloomberg reported on trailing 12 month basis, per share basis.

Price/Earnings (P/E) Ratio: a valuation ratio of a company's current share price compared to its per-share earnings.

Return on Invested Capital (ROIC): a calculation used to assess a company's efficiency in allocating capital to profitable investments.

S&P 500 Index: widely regarded as the best single gauge of large-cap US equities. The index includes 500 leading companies and covers approximately 80% of available market capitalization. One may not invest directly in an index.

AAI000406  09/05/2024