
During our quarterly SS&C ALPS Advisors Investment Committee meetings we spend two days reviewing and critiquing every measure, opinion and narrative we can find to distill a properly broad set of expectations for the medium-term future 12 to 36 months ahead. The goal is to comprehensively build a model of expectations that are reflected in current asset prices – and then to assess where those expectations could be wrong – to help identify and scale the risks and opportunities in markets.
Heading into 2024 the most common questions revolve around handicapping recession and predicting the magnitude and speed of Federal Reserve (Fed) rate cuts. The consensus approach is to look at history and apply the closest analog to our current context and assume history will rhyme. That’s a logical approach, but we lack similar or recent comparisons to use as a map. This cycle has been unique, and our bet is that it will continue to surprise most folks.
One area that is a particularly interesting source of surprise, and we believe sets the stage for a sustainable positive domestic economic future, is the trend and sources of the growth in net worth among less wealthy American households.
Since bottoming in 2010-13 at a secular low of just 0.4% the share of total net worth held by the bottom 50% has grown faster than any other segment of the economy. The bottom half’s net worth has moved from 0.4% to 2.6% in the last decade as a rising wealth tide has lifted all ships.1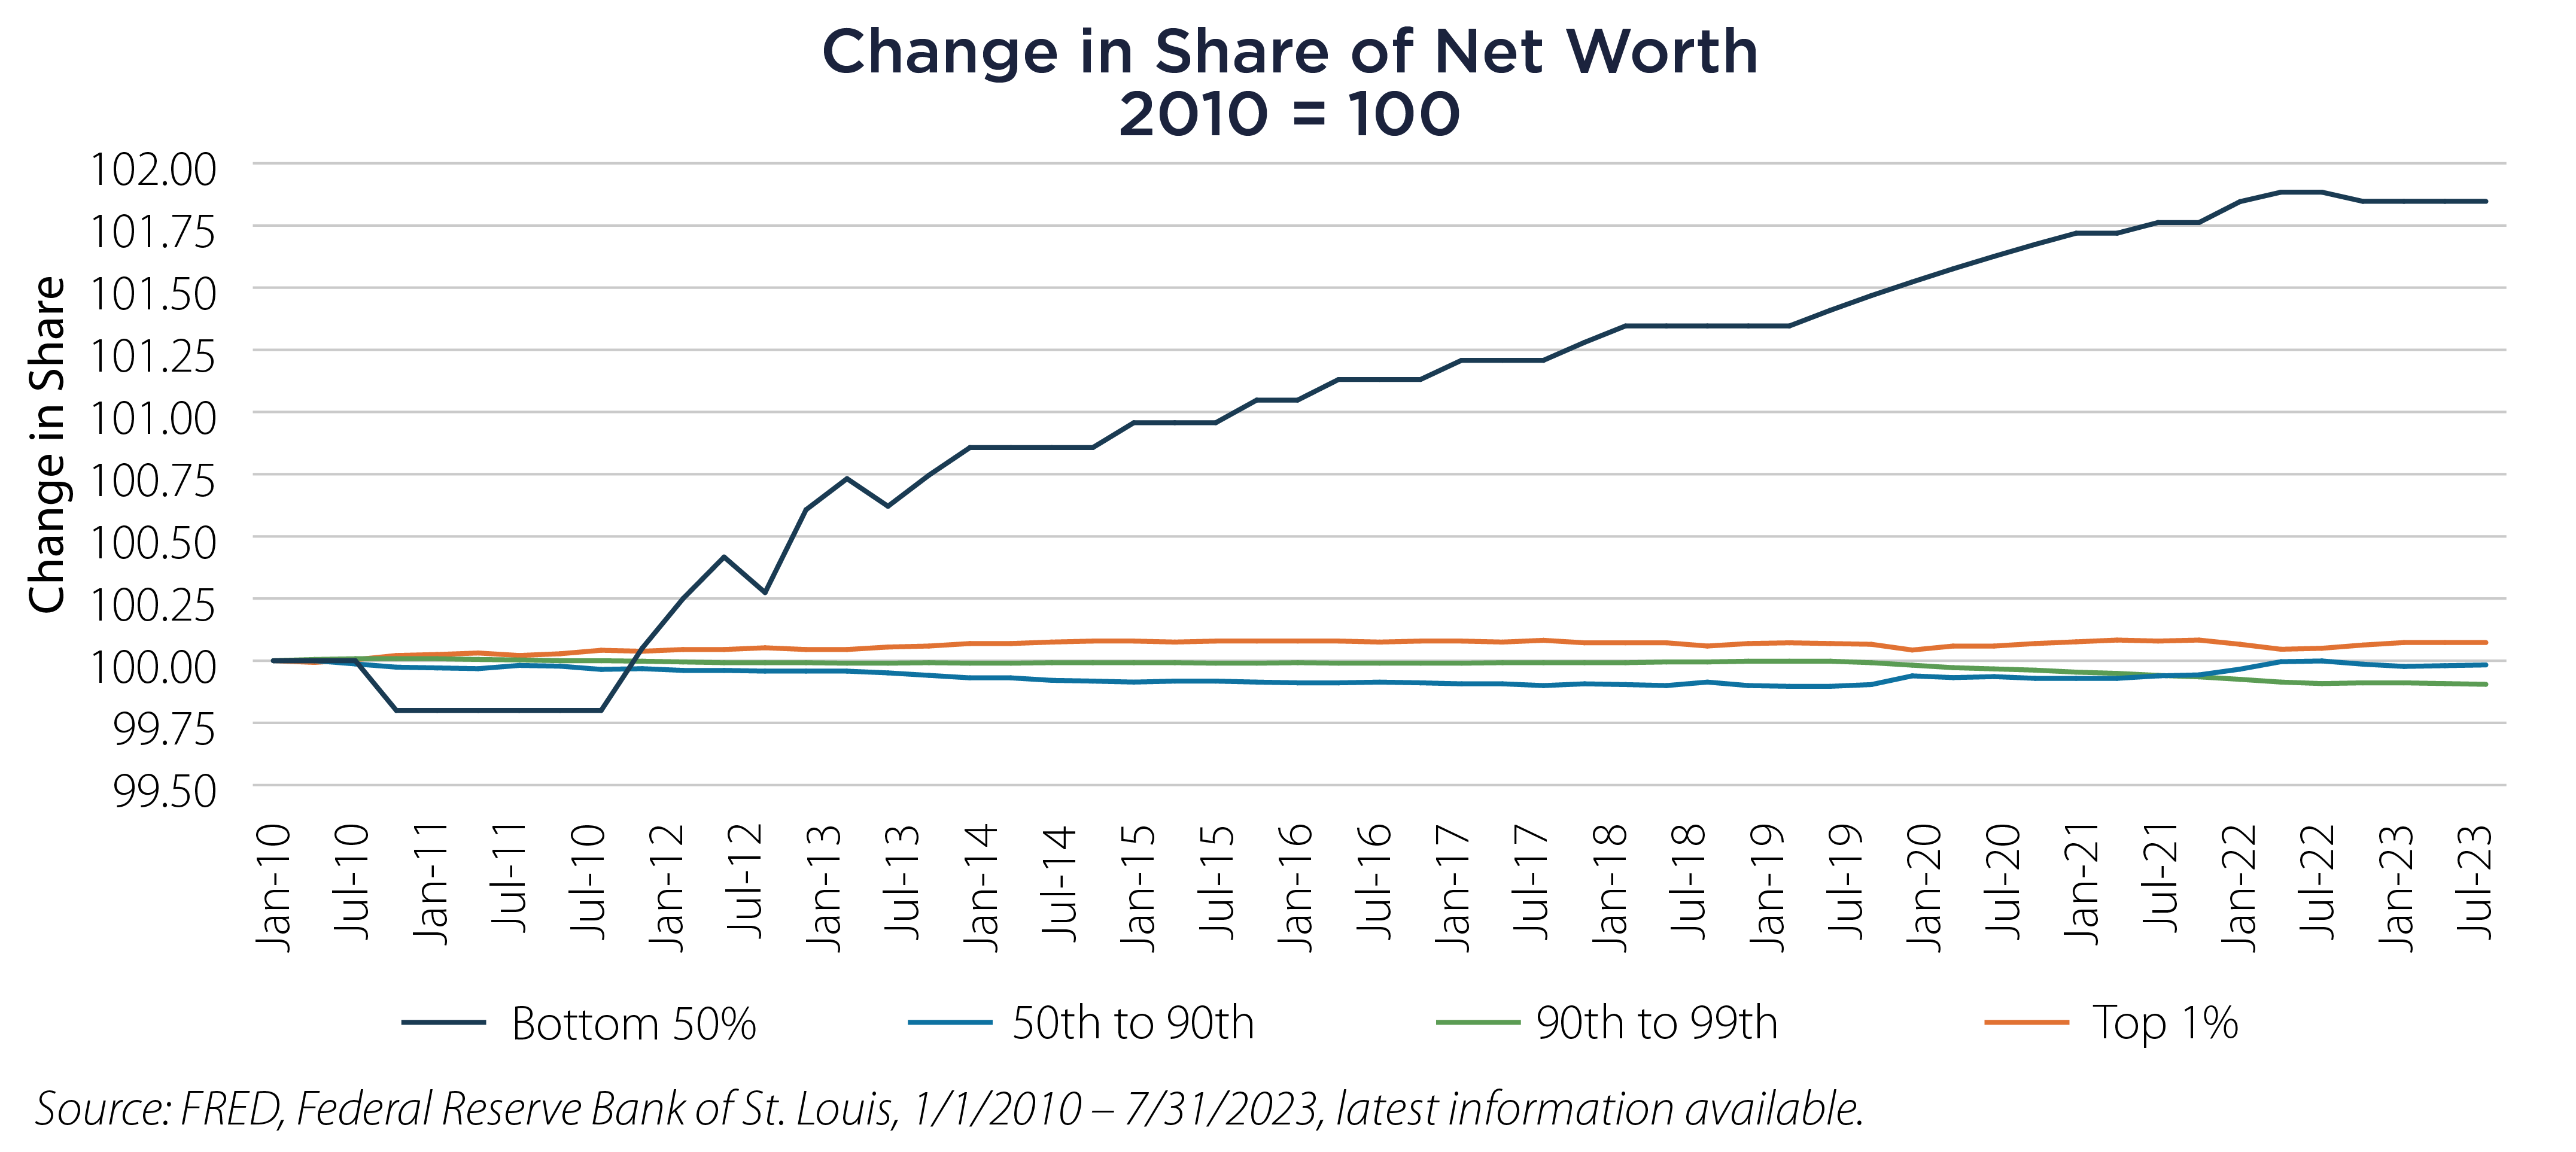
As a brief aside, net worth in a market economy follows a “power law” function that creates exponentially extreme outcomes driven by compounding effects and concentrated economic value. That power law nature makes it unusual for lower levels of net worth to take share from higher levels. It’s also important that both sides of the net worth calculation contribute – higher assets, lower debt.
So how has the bottom half taken back share of net worth? There are two major groupings on each side of the ledger and in each case the benefits are concentrated in the 25th to 50th percentiles (the bottom 25% has rarely carried meaningful net worth).
By far the most significant combination is higher primary and rental home values that have climbed more than 30% since 2010 while home-secured debt increased by less than 4%. It’s a bit surprising that during a period of super-low mortgage rates most owners in this category resisted the temptation to use more debt. Or was it not resistance, but forced conservatism as credit availability evaporated after the financial crisis of 2007-2010? Regardless of the cause, middle class home owners have been smart with debt.
The bigger surprise is likely this second contributor to the shift in net worth; the growth in savings accounts, certificates of deposits and checking account balances – combined with a leveling off of education related debt and credit card debt.
These components are largely a result of COVID-19 pandemic policies and their echo effects. The huge stimulus programs in 2020 and 2021 filled checking accounts, while student debt moratoriums and forgiveness leveled out debt and the aggressive Fed tightening post re-opening made those savings more valuable in the form of high interest rates on savings and CD’s.
All told, these two pairings have largely explained a more than 100% increase in the median net worth for households in the bottom half in the last decade – about double the rate of net worth expansion in the top half.2
This brings us back to a potential key difference in the current economic cycle – arguing for a resilient economy that can thrive even with slightly higher inflation and sustainably higher interest rates than most assume. The facts show that most households – in fact more than 80% - are in the best financial condition they’ve been in, ever! This is a combination of strong growth in home values, frugal debt choices among the middle class and higher earnings on liquid savings. All of which look remarkably sustainable over the next few years. Perhaps 2024 will not follow the predicted narrative of a weaker economy and aggressive interest rate cuts.
Important Disclosures & Definitions

1 Board of Governors of the Federal Reserve System (US), Share of Total Net Worth Held by the Bottom 50% (1st to 50th Wealth Percentiles) [WFRBSB50215], retrieved from FRED, Federal Reserve Bank of St. Louis; https://fred.stlouisfed.org/series/WFRBSB50215, January 18, 2024.

2 Board of Governors of the Federal Reserve System (US), Survey of Consumer Finances 1989 to 2022, retrieved from federalreserve.gov/econres.htm, January 24, 2024.

AAI000593 1/30/2025