
In November of last year, we wrote that the inflation wave had likely topped due to a forthcoming disinflationary impulse catalyzed by rapidly declining energy and goods prices, but that inflation may be more persistent due to three forces:
- Decline in the US labor supply
- Underinvestment in raw materials
- Populist political forces
How could we be bearish and bullish on inflation at the same time?
Part of the answer lies in the analysis of stochastic economic time-series data. A time-series of this type can be decomposed into trend and cycle components. Both are mean reverting, but cycles mean-revert at a faster clip than trends. Trends can last decades if the right forces are present to persist them. Cycles mean-revert more quickly due to shorter term economic forces as well as mechanical artifacts in how the time-series is constructed and reported.
The Consumer Price Index (CPI) series is itself constructed in a way that creates inherent year-over-year seasonality due to base effects, allowing us to forecast the potential path for inflation given month-to-month changes. The associated figures show the potential path for both headline and core CPI out one year given everything we know to-date. Core CPI should continue to slowly drift lower until summer of 2024 due to lagged effects of a previously declining Shelter component. Headline CPI has now bottomed in the near-term as we begin to make comparisons to the rapidly declining goods and energy prices from the second half of last year.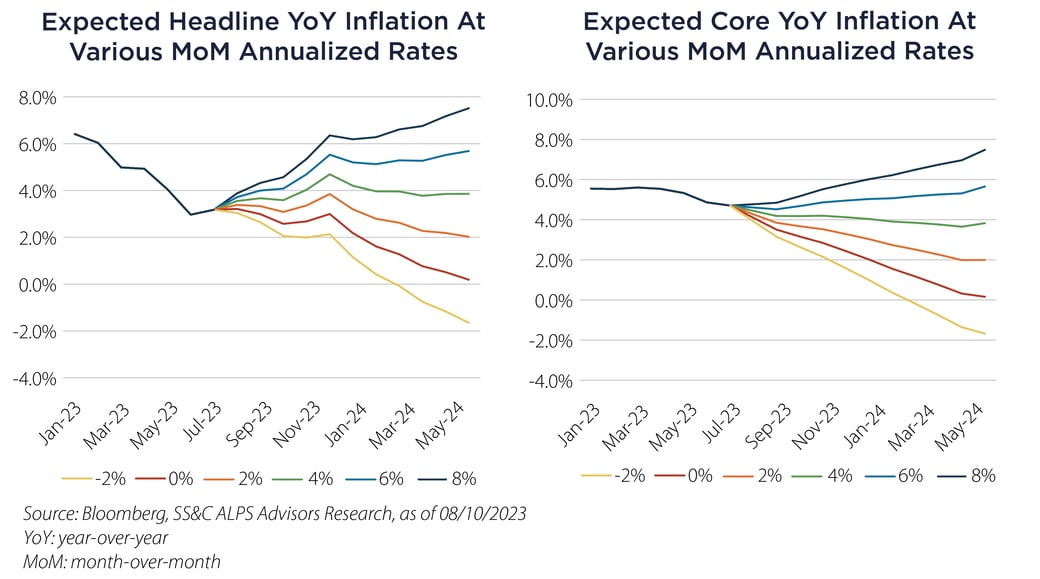 Examining the long-term history of headline inflation in the post-war era, the two major occurrences were the 1940s and the 1970s. The year-over-year CPI inflation spiked multiple times for several years, reducing forward real returns in bonds and in the latter case, stocks as well. Interestingly, market-based expectations today are extremely normal. A look at the real yield curve shows one, two and five year inflation expectations at 1.5%, 2% and 2.3%, respectively. Perhaps bond market liquidity is distorting these observations, but nevertheless it is worth taking note. If they are wrong, the implications for expected returns and asset allocation are enormous.
One way to cut through the noise of cycles is to look at longer-term rates of change. The associated figure shows a scatterplot of the US 5-Year CPI and 5-Year CAPE Ratio for US Large Cap stocks back to 1871 with a third-order polynomial attempting to fit the relationship. What’s notable is that the highest CAPE multiples in the series coincide with approximately two percent 5-year inflation, and then there is a steep drop in multiples as the 5-year inflation rate increases. The red dot shows the relationship as of July 31, 2023. A bit of an outlier.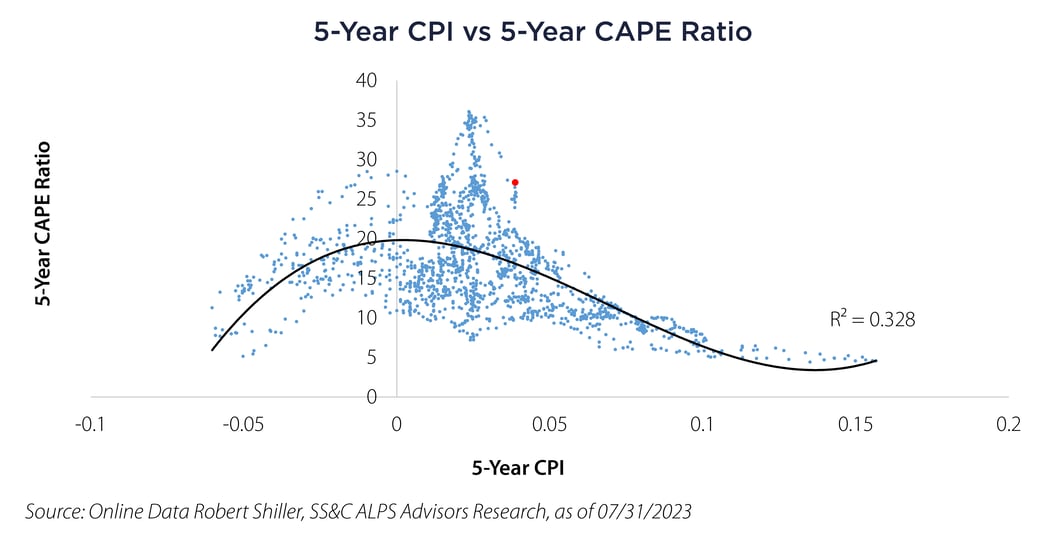 For the reasons we noted at the introduction of this note, we believe there is more than a tail probability that inflation remains persistently above the comfortable 2% level for equity multiples. The latest indication of populist forces fueling inflation was yesterday’s announcement by Kamala Harris of a new rule that updates the Davis-Bacon Act of 1931, mandating higher wages for construction workers. This alongside the $503 billion of private sector investments and the $107 billion of public infrastructure investments made thus far as a result of the fiscal packages from 2021 and 2022 may be the kind of fiscal demand-led wage price cycle that continues to support price pressures.
This is not the 2010s. In this environment, we encourage clients to keenly observe valuations and ensure equity portfolio diversification via small/middle capitalization, international and commodity-linked exposures. Additionally, the latest announcements of the fiscal path for the US has created incremental uncertainty in the rates landscape. Staying flexible with lower duration, diversifying fixed income segments alongside core exposures may act to reduce volatility in fixed income allocations.
Alex Hagmeyer, Senior Director Quantitative Research
Important Disclosures & Definitions

Cyclically-Adjusted Price-to-Earnings (CAPE) Ratio: a valuation metric calculated by dividing a company’s stock price by the average of the company’s earnings for the last ten years, adjusted for inflation.

Consumer Price Index (CPI): a measure of the average change over time in the prices paid by urban consumers for a representative basket of consumer goods and services. One may not invest directly in an index.

R-Squared: in investing, R-squared is generally interpreted as the percentage of a fund or security's movements that can be explained by movements in a benchmark index. An R-squared of 100% means that all movements of a security are completely explained by movements in the index.

Shelter Component of Consumer Price Index (CPI): composed of four separate line items: owners’ equivalent rent (OER); rent of primary residence; lodging away from home; and tenants’ and household insurance. The two most critical components are the OER (>23% CPI weighting) and rent of primary residence (>7% CPI weighting).

AAI000584  08/15/2024