
With heartfelt apologies to Robert Palmer:
“Whoa, you like to think that you're immune to the stuff, oh yeah
It's closer to the truth to say you can't get enough
you know you're gonna have to face it, you're addicted to love DEBT”
While the market celebrated the nearly $80 billion reduction in projected borrowings by the Treasury for the next quarter, we estimate the net interest costs on our national public debt during the quarter were double that amount.1 In plain English, this implies that the Government is currently unable to reduce debt sufficiently to halt the total debt from rising. It’s akin to not making the minimum payment on your credit card. Moreover, there is no current capacity to do so, and it is virtually certain that total debt costs will not decrease next year, given the higher interest costs of newly issued debt. This holds true regardless of whether the Federal Reserve cuts short-term rates or not. Consequently, Congress suspended all debt ceiling limit legislation in March 2023, extending the discussions to January 2025. It will be a crucial issue for the new President and Congress to address. As a result, we currently have no debt limit, and since March, have added $2 trillion over the previous limit ($31.4T).
A 21st Century Phenomenon
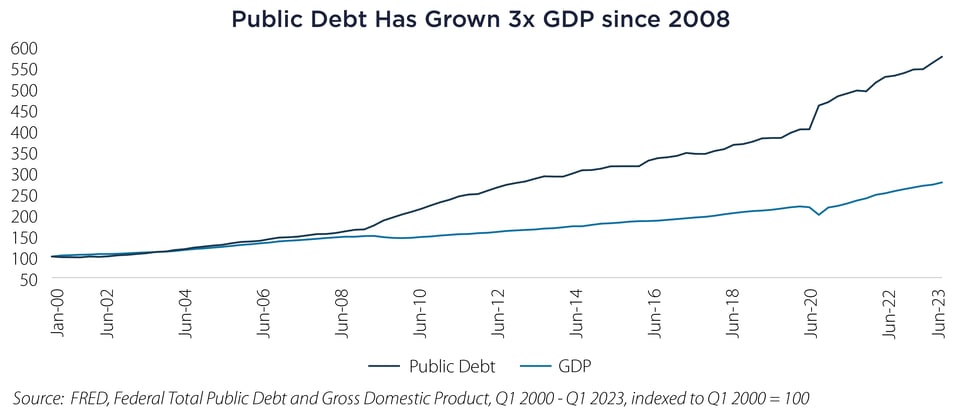
Truth be told, Congress has been addicted to debt rather than implementing tax increases and austerity since the Great Financial Crises. That is when debt began rising materially faster than Gross Domestic Product (GDP), aided by low interest rates. Before then, debt and GDP growth tracked each other. Today’s levels of debt-to-GDP compare to the highest recorded including the previous peak after World War II.2
Now, the law of large numbers and compounding start to impact things. Assuming current revenue trends and rates, the Congressional Budget Office (CBO) forecasts that 20 cents of every tax dollar will go towards interest in a decade, compared to 13 cents now.3 We find ourselves in a higher interest rate regime and a Treasury debt profile that is highly skewed towards short-term rates. Approximately 84% of all new Treasury debt has been issued with two years' maturity or less.4 The good news is the weighted average cost of capital is only 2.97%5 but the bad news is it will likely be much higher next year as new debt is issued, regardless of the tenor distribution. Current 4-5% rates are higher than the 0-1% after the COVID-19 Pandemic.
You may wonder why the Treasury didn’t extend its maturities further when longer term rates were 1%? I mean, pick up the phone, call Jay Powell and get some inside scoop? The answer is because the Treasury operates on a “pay-as-you-go” scheme dictated by the budget cycle and previous debt constraints. Are you surprised the Government lives paycheck to paycheck? The difference is if they don’t get paid enough money to cover their debts the Federal Reserve (Fed) can help them out in the short term. Frankly, there was lack of demand for long term Treasuries at 1-2% after the Pandemic. They have to market and sell a ton of debt.
All Hope is Not Lost
There are some positive trends, not the least of which is inflation has come down, and the Fed has signaled it is likely to cut rates. However, this is not a secular trend that can address a longer-term issue. More positively, individuals and mutual funds have steadily increased their ownership of US Treasuries as longer rates have risen. This has the effect of paying ourselves interest and offsetting the GDP drag. Excluding intra-Government debt the total debt load may be closer to 100% of GDP.6 This is how Japan, with a debt-to-GDP ratio of over 200% (the highest in the developed world by far) has been able to maintain this level for decades. Finally, fiscal spending emanating from the Pandemic is projected to decline, and with no debt ceiling the Treasury may have more flexibility and market demand to spread maturities out, resulting in more time to repay.
What are the Implications for Fixed Income?
There are obvious and not so obvious implications for Fixed Income, but both favor active management in our view. First, Treasury and Mortgage-related debt is poised to represent over 70% of the broad Bloomberg US Aggregate Bond Index this year. This is not an optimal allocation and certainly not indicative of the total return and yield potential available in a Core+ bond fund mandate versus a passive vehicle that primarily invests in lower yielding Treasuries.
Secondly, the main performance driver had been credit prior to the Pandemic. That has shifted to duration and yield curve management in this new era of high Treasury debt loads and increased volatility. These are factors nimble active managers typically exploit. They can react to Treasury refunding announcements, Federal Reserve actions, political uncertainty and gridlock. In short, they aren’t addicted to our Government Debt.
Important Disclosures & Definitions

1 US Treasury Department, net interest costs for FY2023 was $660 billion, or an average of $165 billion per quarter.

2 St. Louis Federal Reserve (FRED), previous high was 1946 with Debt to GDP of 119.1%.

3 Congressional Budget Office (CBO) 2023 Long-Term Budget Outlook Report.

4 SIFMA, Q4 Fixed Income Research Quarterly – Issuance and Trading.

5 US Treasury, Weighted Average Coupon, FYE 2023.

6 Committee for a Responsible Federal Budget (CRFB), for FY2023 Debt held by the public was $26.2 trillion, or about 99% of GDP.

Bloomberg US Aggregate Bond Index: a broad-based benchmark that measures the investment grade, US dollar-denominated, fixed-rate taxable bond market. The index includes Treasuries, government-related and corporate securities, fixed-rate agency MBS, ABS and CMBS (agency and non-agency). One may not invest directly in an index.

AAI000596 02/06/2025