

Summary
Because of the long-term nature of the commodities’ cycle, known as a “super-cycle,” this asset class may go through years or decades of over- or under-performance relative to other asset classes. This low correlation to the traditional business cycle means some investors maintain a regular allocation to commodities for diversification, while others avoid it altogether. Either strategy is likely to be disappointing. A long-term investor should instead include or avoid commodities based on the position in the super-cycle, which can only be understood with thorough and thoughtful analysis.
Forecasting in commodity markets is a much different process from the two main asset classes—equity and fixed income. This stems primarily from the nature of commodities. As nothing more than raw materials, commodities don’t have a cash flow stream associated with ownership.1 Valuation therefore comes down to expectations about supply and demand. These two economic buzzwords contain an incredible degree of complexity, and predicting equilibrium prices in the future involves a thorough understanding of commodity attributes, supply chains, procurement, storage costs, uses and demand trends among myriad other factors.
Our forecasting process begins with analysis of economic conditions and government policy. Economic conditions play a pivotal role in both supply and demand of commodities, with growth, real interest rates and position in the capital cycle being our primary concerns. Economic conditions are the metaphorical river pushing commodity prices along.
Government policy impacts economic conditions, often to a great extent, through interest rates and federal spending (monetary and fiscal policy, respectively). Forecasting economic conditions and government policy is fraught with dangers, and the probability of being exactly correct is near zero. We use scenario analysis to guide our thinking and aim for being approximately correct, which protects us from overconfidence and outsized bets.
After setting the economic stage, we focus down to the individual commodities. If economic conditions are the river, individual commodities are speed boats, sometimes drifting along with the current but capable of heading the other direction in a hurry.
Each commodity is unique and should be understood it its own context. However, a few commodities’ markets are large and important enough that they have spillover effects into other markets. To provide the most value for our clients’ portfolios, we focus on the commodities with the largest markets and the largest impacts. These include oil, natural gas, aluminum, copper and gold. These commodities all play a major role in economic activity worldwide.2
During our analysis, we focus on constraints in the supply chains that could create shortages. We also consider secular demand trends and which commodities may benefit from these changes in consumption patterns.
Finally, we summarize our findings with sector-level and asset class expectations, which are based largely on our key commodities from each sector.
Economic Cycle and Policy Analysis
Although every commodity has its own supply and demand dynamics that may run counter to the macroeconomic (macro) environment, we still view the macro environment as a reasonable foundation for our commodities forecasts. This is the metaphorical river pushing our commodity price higher or lower.
To establish the directional flow of this river, our primary considerations are real interest rates, growth expectations and position in the capital cycle. Estimating each of these factors is fuzzy at best. Our starting point is generally to find what we believe to be the consensus—what value the market assigns to each factor. From there, we may or may not adjust each factor based on our own insights and beliefs. For example, if part of the market’s overall growth expectation includes the prediction that Europe will experience a recession in the next year, we may want to increase our internal growth estimate if we believe Europe’s risk of recession is low.
This process is obviously more art than science, and the probability of being exactly wrong (e.g. missing the GDP growth estimate by 0.1%) is near 100%. Instead of focusing on getting the number value exactly correct, we focus on being approximately correct (e.g. predicting growth will be higher than expected). In order to aid our thinking and to focus on direction and degree instead of precision, we perform scenario analysis with our estimates.
Scenario Analysis
In creating our scenarios, we consider the bull, base and bear case scenarios for commodities broadly. In our example below, our bull case is the “goldilocks” scenario. In this scenario, we describe the conditions for each key factor that would have the biggest positive price impact on the commodity market broadly. This includes high growth, low real interest rates and no new investment. For the bear case, conditions are exactly opposite, and for the base case, we present hypothetical “no change” conditions.
| Scenario (1 year forward) | Probability Assignment | Global GDP Growth | Real Interest Rates | Capital Cycle | |
| Bull Case | High growth, negative real rates, no new investment | Medium | High | Negative | No new investment |
| Base Case | Low growth, low real rates, incremental new investment | High | Low | Low | Incremental new investment |
| Bear Case | Negative growth, high real rates, heavy new investment | Low | Negative | High | Heavy new investment |
For Illustrative Purposes Only
This example scenario analysis includes only our key indicators. But in order to determine values for these indicators, as well as the probability estimates for each scenario, we monitor a host of economic data points. These include measures of unemployment, business and consumer activity and monetary and fiscal policy.
Once we have established the directional flow of the river, we shift our focus down to individual commodities.
Commodity-level Analysis
Keeping track of every commodity and the dynamics that drive their prices is simply not feasible—nor is it relevant from an investment perspective. Many commodities are so small that they don’t even merit their own futures contract. Or, if a contract does exist, it is so thinly traded that liquidity risk outweighs the benefit of direct exposure. In these cases, one may be able to gain indirect exposure through the equity of a company that produces that commodity, but there will be additional risks to consider.
We focus on a few of the biggest commodities (oil, natural gas, aluminum, copper and gold) as well as a few others when they fit into an investment hypothesis.
Because commodities have no cash flow streams associated with them, traditional valuation methods such as the discounted cash flow model and its variations don’t help us. We therefore attempt to predict where the supply and demand curves will be in the future based on an understanding of where they are now.
The Supply Side
The key supply side metrics we monitor for each commodity, all of which vary in relevance depending on the commodity, are inventories, production levels, ramp-up periods, capital expenditures and elasticity. With any commodity we analyze, we map out the general life cycle of the commodity and identify the potential choke points, which will likely relate to one of our key metrics. For example, a certain metal may be almost exclusively generated in a single mine (production levels), and construction of a new mine may take five years before it becomes operational (ramp-up periods).
After establishing where the choke points exist in the commodity life cycle, we regularly monitor these inflection points in light of the current environment3 to determine if the commodity is likely to “choke”—that is, to hit some tipping point that causes the price to take off.
The Demand Side
Under normal conditions, demand is determined by the economic environment. Economic growth generally translates to an increase in demand for most commodities (e.g. oil, copper, aluminum).4 Tying back into our supply side discussion above, it’s possible that seemingly modest demand increases, driven only by economic conditions and not by an event, can cause a commodity to choke. This is more likely in markets with slow response times and long ramp-up periods.
These issues will generally cause a steady and sustained climb in the commodity’s price until either demand is crushed or production is able to ramp up.
An additional lens must be applied to our demand side analysis when we identify a secular demand trend, defined as a shift in consumer preferences expected to persist through multiple capital cycles. A secular demand trend is essentially a change in the elasticity of demand, with consumers becoming less price sensitive to the “in-trend” commodities and more price sensitive to “out-of-trend” commodities.5 The emergence of a secular demand trend may be what kicks off a new commodity super-cycle.
Price
Commodities are unique from other asset classes in that price shouldn’t be expected to increase exponentially. This is also due to the fact that there is no cash flow stream—no revenue generation from holding the commodity.6 This means that current price relative to the long-run average can be an indication of future price movement.
Looking at a price chart of the 1-month natural gas futures contract, we can see that the long-run average from 1990 – 1999 was around $2. The price shot up well above that in 2000, then fell back to the previous average, then spent several years at more than double that average.
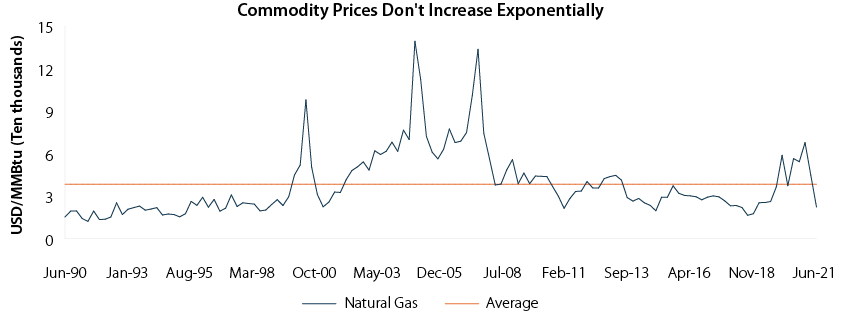 There may be a justifiable reason (such as a secular demand trend) for an extended or even indefinite period where price remains elevated, effectively reestablishing the average at a different rate. However, the natural forces of supply and demand tend to push commodity prices back toward their long-run averages.
Sector Summary
After establishing views on individual commodities, we summarize our expectations in sector-level views. This summary should line up intuitively with our economic expectations, and we must rationalize the view if they do not align. For example, if we have high expectations for growth, but expect the aggregate price movement of energy commodities (e.g. natural gas, oil, gasoline) to be lower, we must rationalize the discrepancy. If we cannot, we must return to our asset-level analysis and reevaluate. This practice prevents us from losing ourselves in the details and missing the bigger picture.
Asset-class Summary
We perform a similar process at the asset-class level. The entire analysis builds to a decision on whether and to what degree an investor should allocate to commodities. The decision to over- or under-weight an asset class may be different depending on the investor’s time horizon.
Long-term investors may only be interested in allocating to the asset class based on position in the super-cycle. If a new cycle is expected to begin soon, an allocation should be added. If not, an allocation should be avoided. Short-term investors may be interested in changing their allocation based on the traditional business cycle or commodity-specific pressures.
If our overall expectations for commodities disagree with our economic expectations, we must again rationalize the discrepancy or reevaluate if it isn’t readily apparent.
1 For more on equity and fixed income valuation and forecasting, see our Framework pieces on these asset classes: Equity Forecasting Framework and Fixed Income Forecasting Framework.

2 Except for gold, which is important not only for its use in daily life but for its low or sometimes negative correlation to the rest of the commodity complex.

3 “Current environment” is necessarily vague, as so many different things must be considered. Not only are we concerned with the economic environment, we are also concerned with geopolitics, politics, financial stability, weather, consumption patterns and technology.

4 It is important to note that “an increase in demand” doesn’t necessarily translate to “an increase in price.” It is possible that the demand increase has already been incorporated into prices.

5 The trend doesn’t necessarily have to be focused on a commodity but may instead be focused on some good that is heavily reliant on a specific commodity.

6 Ok, this isn’t entirely true. If we’re investing in futures contracts, there will be revenue associated with the collateral that must be posted for the contract (collateral yield) and with the rolling of the contract (roll yield). But this is only present when holding and rolling an actual portfolio, not when we’re looking at historical prices of the same maturity futures contract (which is what we’re doing for price analysis purposes).

AAI001054