

Why Invest in Real Estate?
Commercial Real Estate (CRE) is one of the largest investable asset classes globally and comprised over $34 trillion in assets as of 2021.
The business model is quite simple: investors purchase real estate assets, collect rental income from tenants and manage the upkeep of the assets.
The Economic Importance of Real Estate
In a broader context, real estate and housing, in particular, represents a significant component of the overall economy.
Housing's combined contribution to GDP generally averages 15-18%, and occurs in two basic ways:
- Residential investment (averaging roughly 3-5% of GDP), which includes construction of new single-family and multi-family structures, residential remodeling, production of manufactured homes and brokers’ fees.
- Consumption spending on housing services (averaging roughly 12-13% of GDP), which includes gross rents and utilities paid by renters, as well as owners’ imputed rents and utility payments.
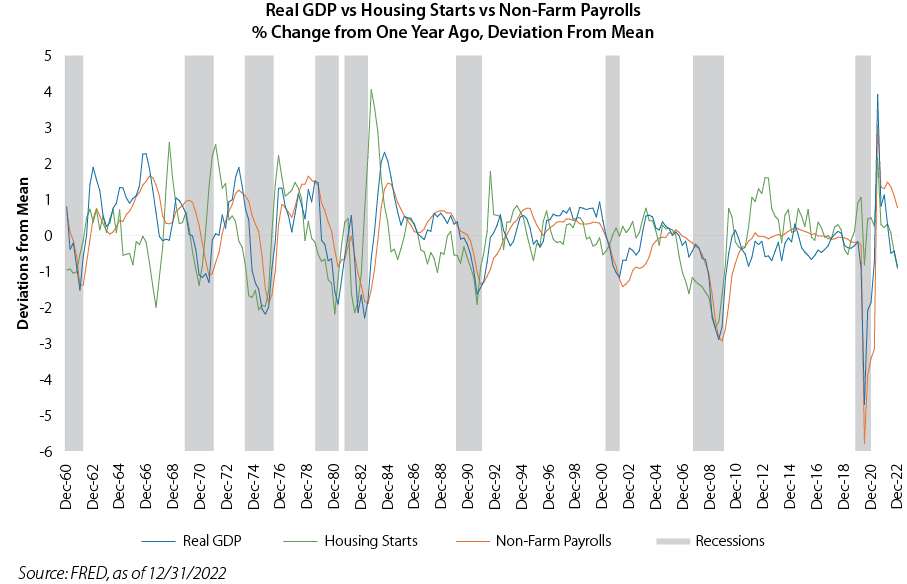
Moreover, according to Edward Leamer’s 2007 NBER paper, “Housing Is the Business Cycle,” there is considerable evidence that housing is the business cycle, and an important determinant for both monetary and fiscal policy. In the nearby Business Cycle Components chart, we observe highly correlated Real GDP, Housing Starts and Non-Farm Payrolls cycles. We also see compelling evidence of the US housing cycle as a leading indicator of growth and employment across business cycles.
 Homeowner equity is one of the largest sources of consumer wealth in the US, representing $27.8 trillion vs ~$40 trillion total market cap of US equities as of June 2022. This “wealth effect” is a significant component of behavioral economics, as consumers feel more financially secure and confident about their wealth when their homes and investment portfolios increase in value.
Beyond real estate investing, given its outsized economic influence, our investment team uses CRE and housing data for additional context and insights for investment research, investment strategies and investment model allocations.
General Investment Characteristics
CRE provides both equity and bond-like characteristics. Given supply constraints (scarcity of land and attractive locations) and increased demand (population and economic growth), along with the inflationary effects of replacement costs, CRE provides potential growth for investors. The monthly rental income from tenants provides attractive and stable yields while shorter term (1-2 year) contracts provide some protection from the effects of inflation. Over longer investment horizons, real estate has historically provided returns similar to equities.
Access to CRE is available both in public (REITs) and private vehicles. Due to their unique structure, REITs provide the traditional equity and bond-like characteristics along with a significant structural advantage - REITs pay no corporate taxes. To qualify as a REIT, the entity must:
- Invest 75% of assets in real estate and cash
- Obtain 75% of gross income from rent and mortgage interest
- Pays 90% of taxable income to shareholders
Private real estate is available in pooled funds and limited partnership structures. Although our focus is REITs, there are important market signals from the private markets that we monitor and interpret for our REITs investment framework.
Public REITs have ~0.60 correlation to equities and ~0.35 correlation to bonds, so they provide significant potential portfolio diversification benefits. In addition, public REITs have ~0.85 correlation to private real estate.
The CRE market is diversified, with various sectors participating in differing markets each with unique sensitivities within the overall economy. These include:
| Real Estate Sector | Markets |
| Residential | Housing |
| Office | Office Space |
| Industrial | Supply Chain, Logistics, Warehouses |
| Retail | Consumer |
| Lodging | Travel |
| Self-Storage | Consumer |
| Health Care | Health Care Delivery and Laboratories |
| Towers | Mobile Communications |
| Data Centers | Cloud Computing |
| Timber | Construction |
Real Estate Investment Framework
| Framework Component | Steps | Output |
| I. Baseline Expected Returns | 1. Dividends 2. Earnings growth 3. Changes in valuation |
Baseline expected REIT returns |
| II. Macro & Secular Trends | Analysis of economic data and secular trends | Assessment of potential impacts • Net rent increases • Changes in valuation |
| III. Relative Valuations | 1. Expected REIT income yields 2. REIT income yield spreads vs bonds |
Overall positioning • Neutral (market weight) • Overweight • Underweight |
| IV. Monitoring | 1. Ongoing assessments of valuations 2. Assess REIT income yield spreads |
Assess and update positioning |
Framework Process
Our framework includes both quantitative and qualitative analysis to assess potential returns and risks with the objective of positioning portfolios to achieve better risk-adjusted returns. The process can be summarized as follows:
- Establish baseline estimates for REIT returns for the following 12 month period
- Evaluate macroeconomic data and secular trends to develop likely market scenarios
- Determine relative valuation by comparing REIT income yield spreads vs bonds
- Monitor valuations and developments, assess and recommend changes as conditions warrant
Baseline Expected REIT Returns
Similar to equities, total return for REITs is comprised of three primary components:
- Dividends
- Earnings growth
- Changes in valuation
Not unlike bonds, income yield (from dividends) can provide a simple and effective starting point for forecasting long-term returns. For REITs, we can use Cap Rates (Net Operating Income/Market Value) as an estimate for income yields.
Earnings growth is driven by growth in net operating income (NOI), primarily through rent increases and cost management. Key metrics:
- NOI growth
- General and Administration (G&A) as % assets
- Balance sheet leverage and cost of capital
Changes in valuation are driven by material changes in supply/demand dynamics (primarily secular trends, technological changes, and economic incentives), replacement costs and the underlying capital structure of the REIT. Key metrics include:
- Occupancy
- Balanced sheet leverage and cost of capital
- Dividend coverage
Private real estate cap rates, growth and valuation changes are also incorporated into these baseline models.
Macroeconomic Data and Secular Trends
REITs are subject to numerous macroeconomic and secular trends, with varying impacts across sectors. These include but are not limited to:
- Interest rates – impact on cost of capital, balance sheets, debt maturity and ability to refinance
- Overall economic growth
- Regulatory trends and incentives – tax policies, energy efficiency, renewable construction materials, etc.
- Purchase vs rent housing costs – Driven by supply/demand, interest rates and demographic trends, this dynamic has shifted back and forth for several decades
- Work from home – lower demand for office space, along with knock on effects for retail, among others
- E-commerce – increased demand for supply chain, logistics; lower demand for retail
- Technology – cloud computing, 5G, cell towers and data centers
We use this information to calibrate and adjust overall cap rates to reflect potential secular and macroeconomic impacts and establish the expected CRE Income Yield.
REIT Income Yield Spreads vs Bonds
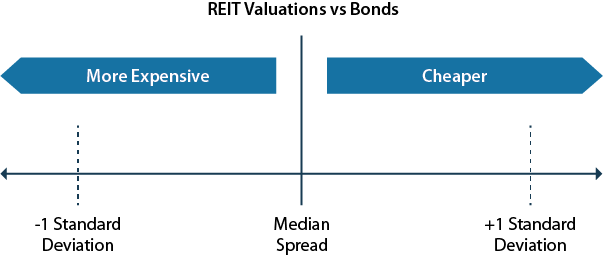
Our final step is to compare expected REIT Income Yield to bonds using historical spread levels as they have consistently provided insights on the direction and magnitude of expected REIT returns. When the spread is less than the median spread vs bonds, REITs are considered “expensive” and investors are unlikely to be compensated for the additional risk of the potential outperformance relative to historical returns.
For context, we establish spreads for REITs vs both investment grade and high yield (HY) corporate bonds. For additional context, we create a valuation range of median spread +/- one standard deviation of the historical spread.
We use these comparisons to establish “cheap” vs “expensive” vs bonds in a historical context and establish recommended allocations in our investment models.
 Monitoring
The monitoring and assessment of relative valuations is an ongoing effort. At a minimum, on a quarterly basis, the valuation model and comparisons are updated and reviewed. When valuations and outlook warrant, the model allocations recommendations are updated.
AAI001059