
Liquidity in the Driver’s Seat with Central Banks Riding Shotgun
We've observed a growing chorus within the investment community that references one chart to explain stock market returns since 2013. This chart is believed to provide a framework for future stock market returns, with the prevailing message being that global (central bank) liquidity is the primary driver, rendering other analyses unnecessary.
The underlying logic from expanding balance sheets is that when central banks buy assets (and increase their balance sheets) they inject cash into global markets which can be used to bid other financial assets higher. Conversely, when central banks shrink their balance sheets they withdraw cash from markets, thus lowering cash available to purchase financial assets and potentially driving prices lower.
The commentary surrounding this chart has become so pervasive that we constructed our own indicator a few months ago, replicating this view (seen in the chart below), and continue to monitor its underlying components regularly. Given the high correlation between central bank liquidity, as defined below, and the S&P 500, it's evident why so many are paying attention.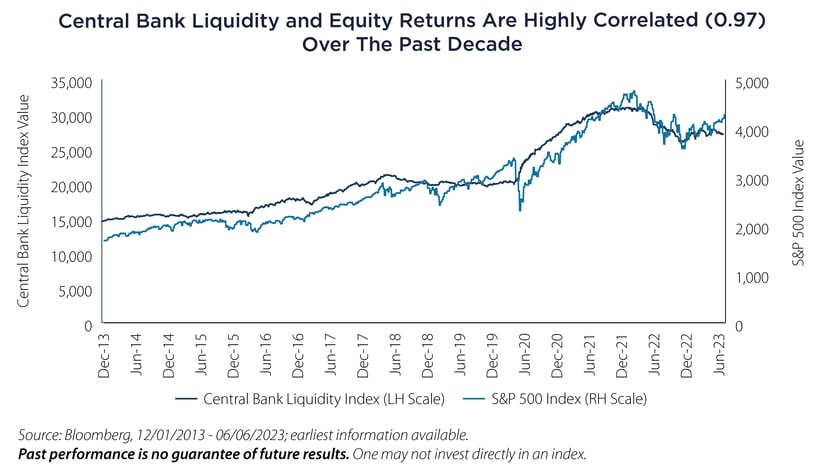 Is that All I Really Need to Know?
Now that we have all seen the chart and internalized its message, does global liquidity truly hold the key to understanding stock market dynamics, leaving no room for other considerations? What about the Federal Reserve tightening cycle, rising interest rates and their impact on corporate earnings? How about the surge in investor awareness of the potential productivity gains from artificial intelligence (AI), or the visible earnings durability exhibited by large-cap US companies like Apple, Microsoft and Google?
Let us make a bold statement: markets are currently at a unique moment in time. When investors make such a statement, it is often simultaneously true and false. It is true because no circumstances driving equity prices are ever exactly the same. However, it is false because the uniqueness of the present moment is no greater than that of any other time when analyzing potential equity market returns; forecasting returns is always a challenging task.
Taking a Step Back and Assessing
Reasons to be optimistic about equity markets:
- The Federal Reserve tightening cycle is nearing a peak, or at least approaching a pause, as the Federal Open Market Committee signals the need to observe the impacts of higher rates on economic growth and inflation.
- Inflationary pressures are easing, and inflation is trending lower.
- The broader economy remains robust, evidenced by strong employment levels, as reflected in the recent increase in employers seeking workers and a low unemployment rate. Housing, despite mortgage rates ranging from 6.5% to 7.5%, has also stabilized and shown signs of improvement.
- Resilient business models have generated strong earnings for leadership companies such as Apple, JP Morgan, Microsoft and Google.
- Every bull market requires a theme, and the excitement surrounding AI aligns with this profile. Nvidia, often regarded as the poster child, has experienced an astounding 167% year-to-date increase and recently surpassed a market capitalization of $1 trillion.
Reasons to be pessimistic about equity markets:
- Interest rates are high and are likely to remain elevated for an extended period, driven by economic strength and inflation surpassing the Federal Reserve's 2% target.
- The Federal Reserve has transitioned from quantitative easing (QE) to quantitative tightening (QT), resulting in a reduction of the Federal Reserve's balance sheet.
- Some estimates for future corporate earnings, including those from Morgan Stanley, are declining.
- As part of the agreement to increase the US government debt ceiling, Congress has agreed to resume deferred student loan payments at the end of August, potentially introducing financial strain for individuals and affecting consumer spending, which can indirectly impact equity markets.
- Stress within the US regional banking system has led to banks like Silicon Valley Bank and others going into receivership.
Furthermore, the US Treasury Department is about to withdraw approximately $1 trillion in liquidity from the global financial system as it refills the TGA (Treasury General Account) through the issuance of US Government Treasury Bills to investors, now that the US Debt Ceiling has been lifted.
Maybe our chart comparing Central Bank Liquidity versus the S&P 500 is all you really need to know.
Important Disclosures & Definitions

Central Bank Liquidity Index: US dollar value of Central Bank Total Assets (G5 (France, Germany, Japan, United Kingdom and United States) + China) minus [US Reverse Repo Facility Assets + US Treasury General Account Assets].

S&P 500 Index: widely regarded as the best single gauge of large-cap US equities. The index includes 500 leading companies and covers approximately 80% of available market capitalization.

One may not invest directly in an index.

Performance data quoted represents past performance. Past performance is no guarantee of future results; current performance may be higher or lower than the performance quoted.

AAI000293  06/13/2024