
•    Despite recent large-cap outperformance, the US equities landscape demonstrates few advantageous asymmetries.

•    Overall, valuations in various sectors seem favorable, with minimal areas showing excessive richness.

•    Macroeconomic forces, particularly in rate-sensitive segments, hint at potential opportunities amid interest rate policy shifts, notably impacting small-cap and cyclical stocks.
As we survey the US equities landscape, although there has been a recent surge in large-cap growth over the past year and a half, opportunities for profitable asymmetries remain limited. Generally, valuations appear favorable across various sectors, with few areas displaying excessive richness. Nevertheless, we cannot overlook the impact of macroeconomic forces on the more rate-sensitive segments of the market, suggesting potential opportunities in the event of a shift in interest rate policy.
While we avoid speculating on the actions of the Federal Reserve Board members or the future trajectory of inflation, it's crucial to acknowledge that the current monetary policy regime is influencing winners and losers in today's market environment. This has notably affected small-cap and more cyclical stocks, which have faced challenges in the current environment due to their higher levels of leverage.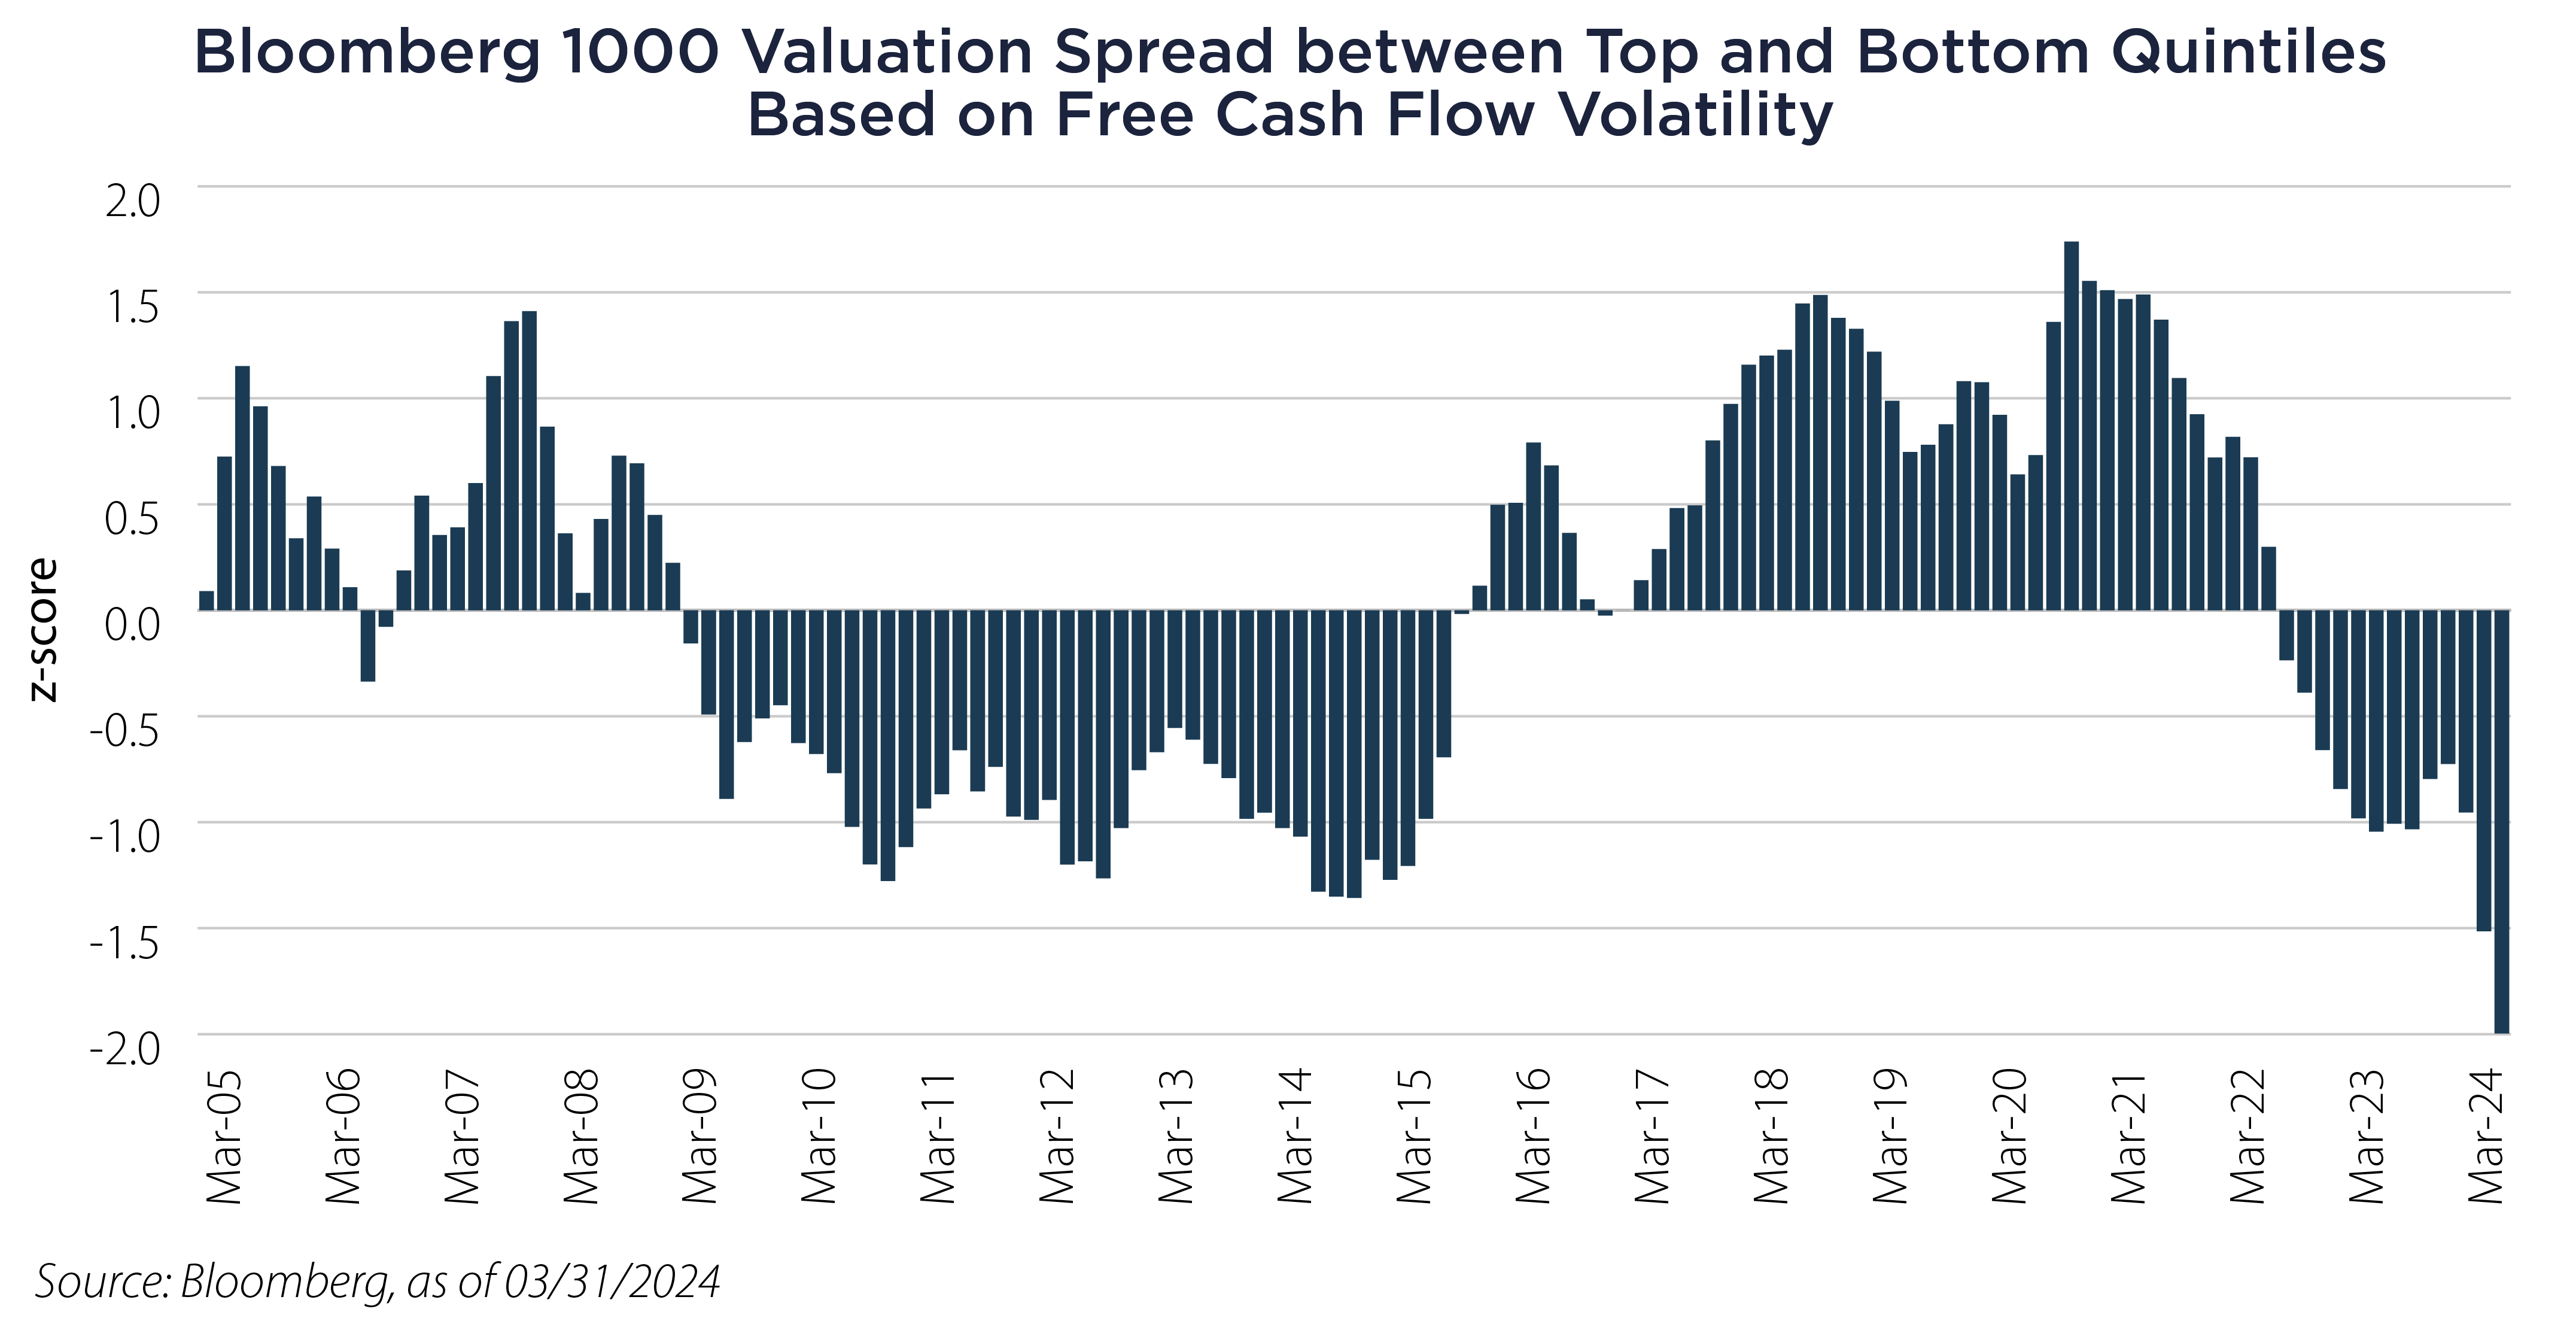
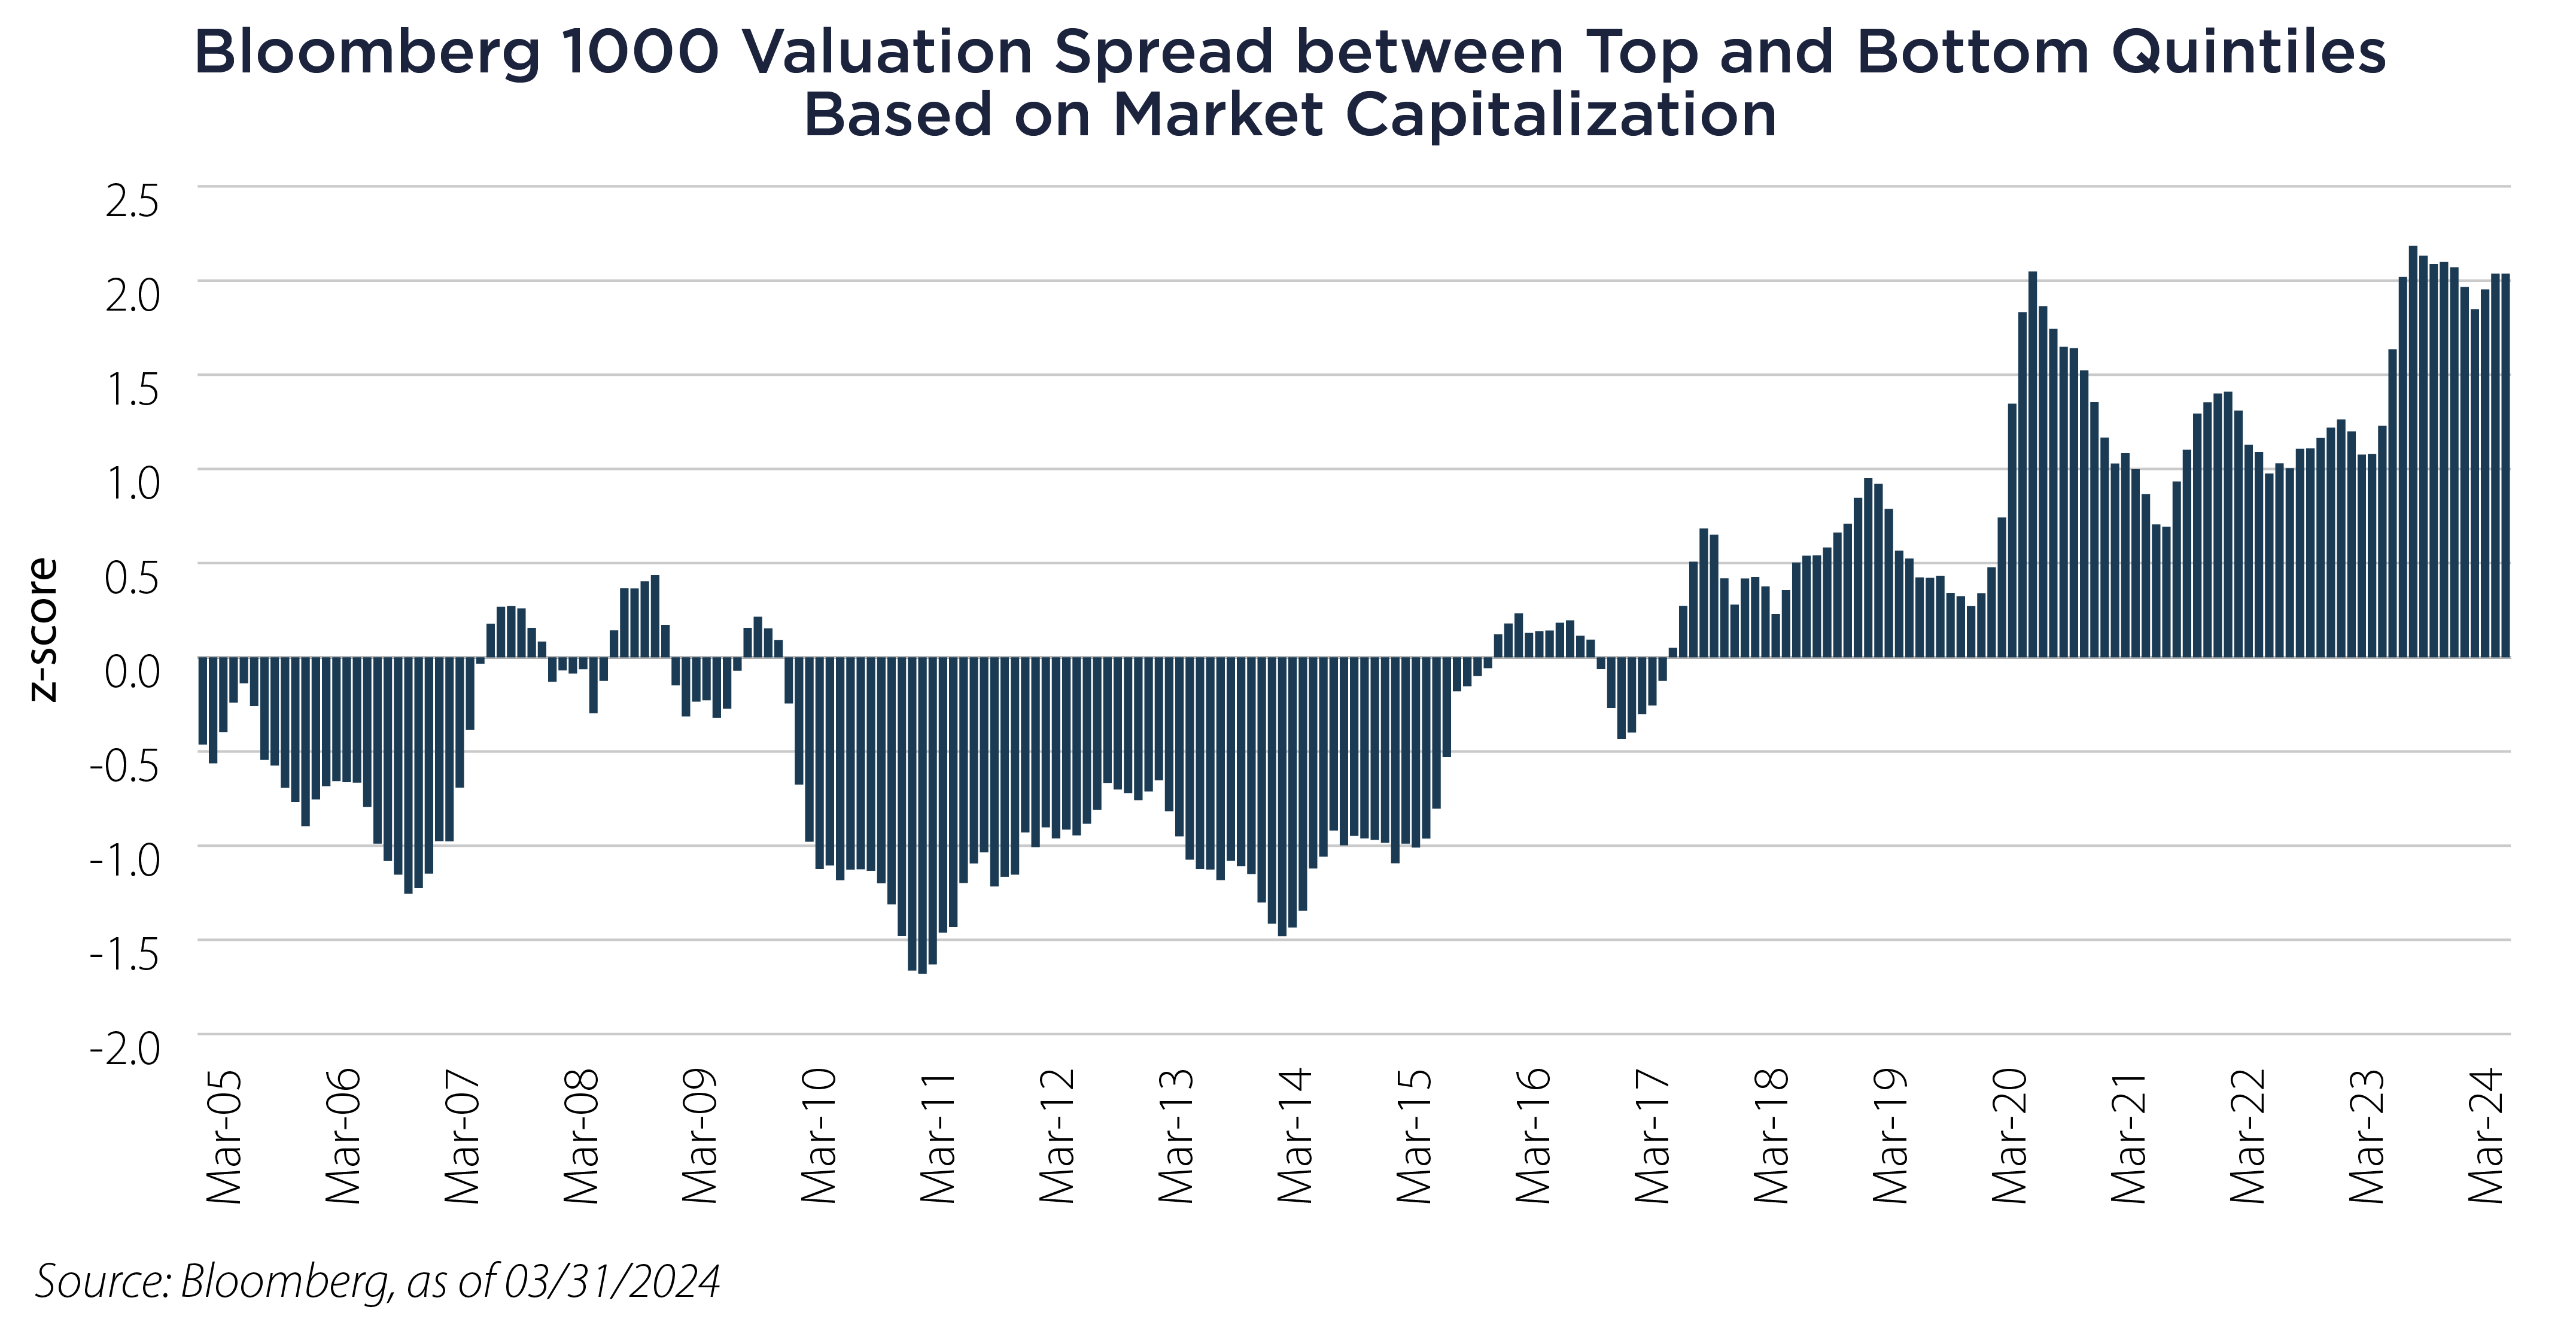 As depicted in the nearby charts, the valuation spreads between top and bottom quintile stocks, determined by size and free cash flow volatility, are nearing two standard deviations from the norm. This places them outside the range of approximately 95.4% of occurrences. If monetary policy were to reverse in the future, there could potentially be an exploitable opportunity in the normalization of these two factors.
Important Disclosures & Definitions

Bloomberg US 1000 Index: a float market-cap weighted benchmark of the 1000 most highly capitalized US companies.

Free Cash Flow (FCF): a measure of cash earnings that excludes the non-cash expenses of the income statement but includes capital assets as well as changes in working capital from the balance sheet.

Z-Score: a numerical measure that describes a value’s relationship to the mead of a group of values, measured as standard deviations from the mean. If a Z-score is 0, it indicates that the data point’s score is identical to the mean score. A Z-score of 1.0 would indicate that the value is one standard deviation from the mean.

One may not invest directly in an index.

AAI000678 04/16/2025