

Wealth optimization is complicated.
Risk tolerance questionnaires aim to identify an investor’s willingness to experience market volatility, aligning them to portfolios based on risk to capital. On the other hand, investors have complex goals that require funding. To avoid risk to plan, risk to capital is essential. In this week’s Two Minute Tuesday (TMT), we introduce foundational concepts on which to build an optimal Equity Core portfolio that aims to achieve returns that structurally exceed the market with less risk to capital. While every financial plan is personal, the Equity Core is a powerful tool for investors with a primary goal of growing their capital.
The Strategy
|
|
|
First, a quick background for those unfamiliar with asset pricing research. Eugene Fama and Kenneth French were pioneers in equity factor analysis and have made their data publicly available. In 1992, they released a paper1 that challenged the Capital Asset Pricing Model (CAPM), suggesting that smaller capitalization stocks and cheap stocks tend to outperform their expected returns based on CAPM.
In 2014, they released additional research2 that added two additional criteria to the model for determining excess returns: profitability and investment. These criteria can be thought of as Quality factors because businesses with higher profitability and conservative investment characteristics typically have more stable earnings, stronger balance sheets and higher margins.
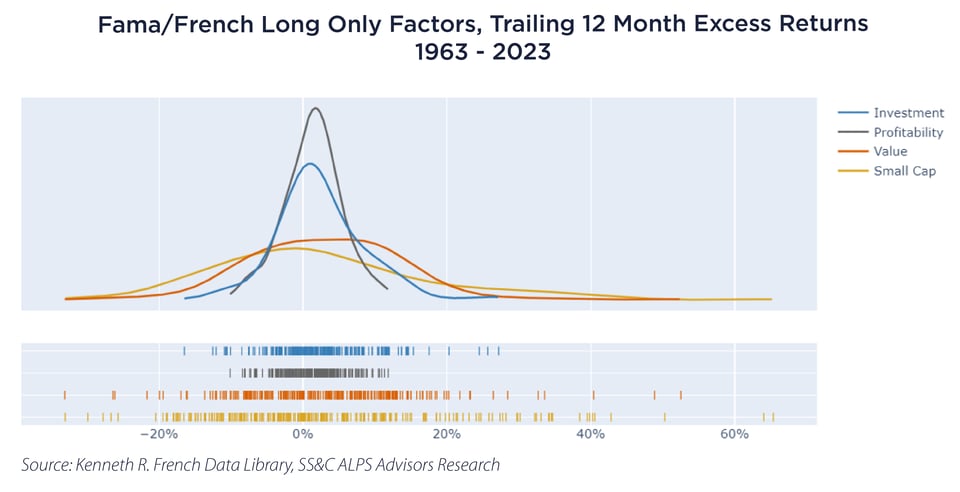
Each of these factor portfolios rebalanced annually outperforms the market on average over the last 60 years. Furthermore, their excess returns have low correlations to one another, making them powerful components to draw upon for the construction of diversified equity portfolios.
While this is a great starting point, our practical experience in equity markets demands further investigation of the data to align more closely with our intuition in stock selection and portfolio construction.
Structural Edge: Quality Growth
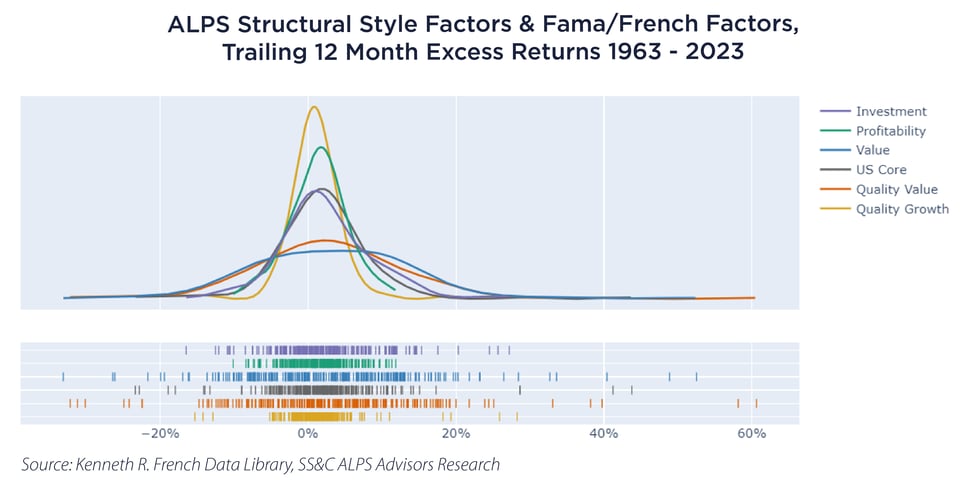
What about Growth stocks? While Growth in isolation achieves a dubious risk premium historically, it can be a powerful component when actively overlaying Quality. In fact, excluding the bottom 40% of stocks on Profitability from the most expensive 60% on Value generates an interesting portfolio return stream which we call Quality Growth. The selection of 60% and 40% is designed to capture the most profitable segment of businesses rated as average to expensive valuation based on Kenneth French’s publicly available historical data. This screen identifies businesses that are justifiably more expensive than cheap stocks and more likely than not include “compounders”, an essential part of the Equity Core allocation.
Structural Diversifier: Quality Value
While Value as a style outperforms over the long-term, it tends to be episodic, and our preference is to tilt towards higher Quality. When excluding the bottom 40% of stocks on Profitability from the cheapest 40% of stocks on Value and equal-weighting that allocation with the highest 30% of stocks on Dividend Yield, we identify a lower risk version of Value that also expresses Quality and compounds dividends for the investor.
A mean-variance optimization on these structural factors’ 60 years of historical returns with quarterly rebalancing suggests a 50/50 allocation as optimal. The returns distribution, labelled “US Core” in the figure below, speaks for itself.
| Annual Return | Annual Volatility | Sharpe Ratio | |
| Market | 11.3% | 17.1% | 0.66 |
| Quality Growth | 12.5% | 16.8% | 0.74 |
| Quality Value | 14.0% | 17.9% | 0.79 |
| US Core | 13.3% | 16.8% | 0.79 |
Source: Kenneth R. French Data Library, SS&C ALPS Advisors Research
Strategic Diversifiers
Both International and Small Cap stocks do not hold water to our structural factors in broad US stocks with respect to consistency in long-term risk and reward, but they do have low correlations and thus can add value in further diversifying a US Large Cap portfolio. For example, a minimum risk optimization on broad exposures to US and International stocks’ returns back to 1970 identifies a 60/40 US/International allocation as having the lowest expected volatility.
Because both International and Small Cap stocks have highly variable and more regime-dependent excess returns, the use of forward-looking capital market assumptions to assess dividends, business cycle growth and mean reversion across these segments is critical. When those capital market assumptions are proven directionally correct, adding strategic diversifiers as allocations to an Equity Core portfolio can have a significant effect on the risk and return structure.
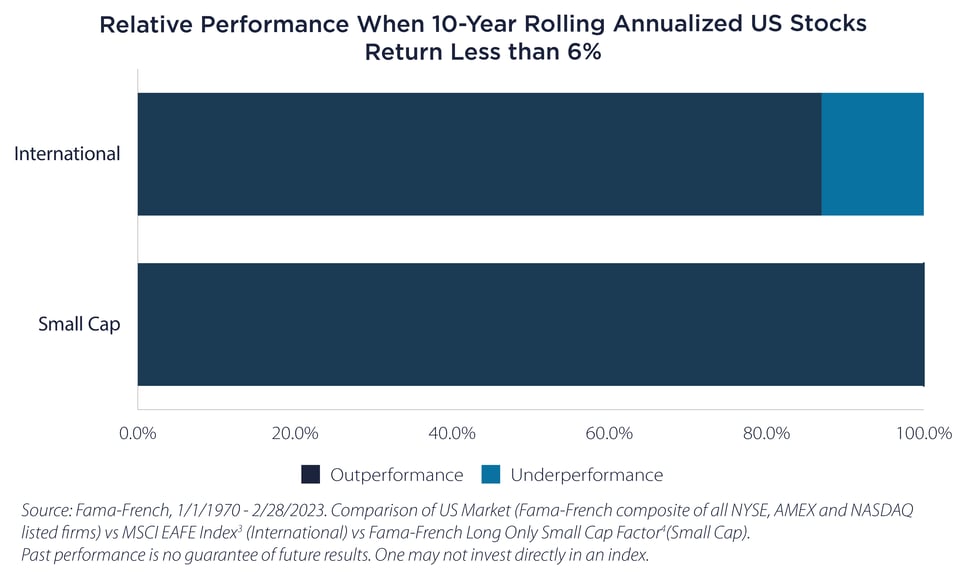
For example, over the last half century when the 10-year annualized return from broad US stocks was less than 6%, US stocks averaged +2.4% per annum over 10 years. During those same 10-year periods, International and Small Cap stocks averaged +3.9% and +7.9% per annum, outperforming their US broad market peers in 87% and 100% of rolling observations, respectively.
Rebalancing
Finally, when there is more than one exposure in a portfolio, the original allocations will change through time as markets fluctuate. Rebalancing periodically or around significant market dislocations reestablishes those allocations, selling exposures that have appreciated in value and buying those that have fallen. This process systematically targets and, in many cases, reduces portfolio risk, further enhancing the risk reward characteristics of the managed portfolio.
Remarks
The combination of Structural Edge and Diversifying Core components alongside additional Strategic Diversifiers offers a differentiated portfolio approach that may offer excess returns at equal or lower market risk. Please feel free to reach out to the SS&C ALPS Advisors Multi-Asset Research Team for more information. We look forward to providing more portfolio construction insights in future TMTs.
Important Disclosures & Definitions

1 Fama, Eugene F & French, Kenneth R, 1992. "The Cross-Section of Expected Stock Returns," Journal of Finance, American Finance Association, vol. 47(2), pages 427-465.

2 Fama, Eugene F & French, Kenneth R, 2014. “A Five-Factor Asset Pricing Model,” Journal of Financial Economics, vol. 116, pages 1-22.

3 MSCI EAFE Index: An equity index which captures large and mid-cap representation across 21 Developed Markets countries around the world, excluding the US and Canada covering approximately 85% of the free float- adjusted market capitalization in each country.

4 Small Cap Factor: The small-capitalization premium (size effect) says that low capitalization stocks can provide substantial premiums compared to large capitalization stocks without additional risk. This anomaly was described by Fama and French in 1993.

Performance data quoted represents past performance. Past performance is no guarantee of future results; current performance may be higher or lower than performance quoted.

AAI000291