
Greg Zuckerman’s 2019 book, The Man Who Solved the Market: How Jim Simons Launched the Quant Revolution, tells the story of how Jim Simons built one of largest and most successful quantitative hedge funds in history. To summarize, Simons believed and proved that he could use machine learning models to exploit anomalies revealed throughout historical pricing data. By 1997, the model development process consisted of three key steps aimed at uncovering statistically significant profit-generating strategies:
- Detect unusual patterns within historical pricing data.
- Validate that these anomalies held statistical significance, exhibited consistency over time and were not simply random occurrences.
- Investigate whether the identified pricing behaviors could be reasonably explained.
The implicit message underlying this story argues the supremacy of scientific methods over technical analysis. Simons regarded technical analysis as a primitive approach to statistics that inspired human pattern recognition instincts but lacked the necessary grounding in rigorous statistical validation. While we remain agnostic to this debate, we have found that much of this year’s rally can be explained by the reversion of a particularly prominent anomaly. Something that you may have missed if you were paying too much attention to head and shoulders patterns.
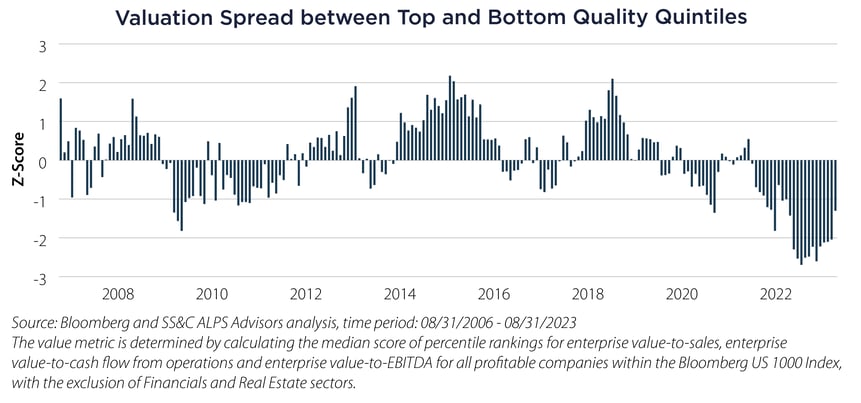
The above chart depicts the normalized difference between the median valuation of the top and bottom 20% of return on invested capital (ROIC) companies within the Bloomberg US 1000 Index. Think of this as the difference in valuations between the highest quality and lowest quality companies. Given the data's normalization, a level below zero signifies a narrower gap in valuations, while a level above zero denotes a more significant divergence.
Among this top 20% bracket of ROIC leaders are several prominent US-listed giants, including Apple, Google, Meta, Nvidia and Adobe. The year 2022 witnessed a substantial compression in the valuations of these companies, to the extent that by November, the valuation spread had plummeted to 2.5 standard deviations below the mean. In contrast, 2023 has witnessed an upward reversion to those valuations that has played a pivotal role in driving much of this year's stock market gains.
Our present-day market observations remind us of the power hidden within statistical anomalies. The resurgence of valuations among top-tier companies in 2023 underscores the enduring relevance of Simons' principles. In a world filled with chart patterns and trend analysis, it's essential to recognize that sometimes the most impactful insights come from embracing the disciplined pursuit of data-driven statistics rather than defaulting to heuristic-based pattern recognition. As we navigate the complexities of financial markets, Simons' legacy serves as a guiding beacon toward uncovering profitable opportunities.
Important Disclosures & Definitions

Bloomberg US 1000 Index: a float market-cap-weighted benchmark of the 1000 most highly capitalized US companies. One may not invest directly in an index.

AAI000419  09/26/2024