The consensus narrative of an imminent economic recession has once again been muted by relative stability in company earnings, employment and other economic data. Our work on sequential sentiment cycles leads us to believe that this narrative will continue to lose momentum in the near-term.
In January, we discussed the risk premium expansion that occurred in 2022 and the opportunities afforded to the multi-asset investor at that time. Today, we believe there is a strong possibility that real economic growth is reaccelerating into 2024.
The Sequential Sentiment Cycle
First, the manufacturing inventory cycle has reset. In the associated chart we show the Institute for Supply Management (“ISM”) Purchasing Managers Index (“PMI”) headline figure as well as a combination of two subindices: the New Orders Index less the Inventories Index. This combination is meant to capture differences in purchasing manager sentiment for their inventories relative to new orders.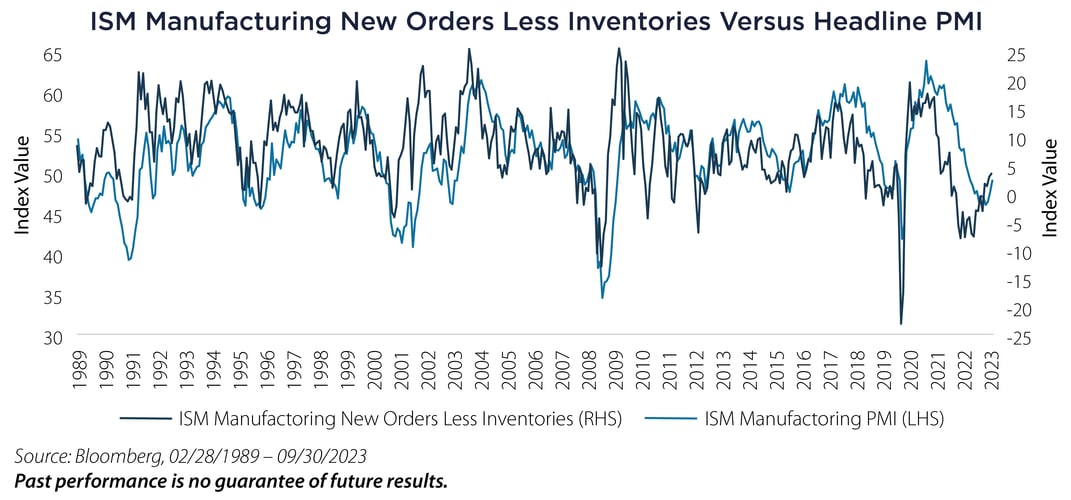 The three-month average of new orders less inventories is now positive after a negative twelve-month average. That has happened only twice back to 1989 – in 2009 and 2020. While manufacturing has become a smaller part of the overall US economy, it remains a significant part of global economic activity. The implication is for ex-US equity markets and cyclical segments to respond in the form of higher expected relative returns.
Another indicator of activity picking up is the recent change in the Association of American Railroads Weekly Intermodal US Freight Carloads. Shown in the associated figure, freight traffic in 2023 fell 15% below the average level of the previous two years. This tells the story of the inventory destocking that took place in the first half of 2023 following the consumer demand explosion in 2021 and the retailer inventory overshoot in 2022.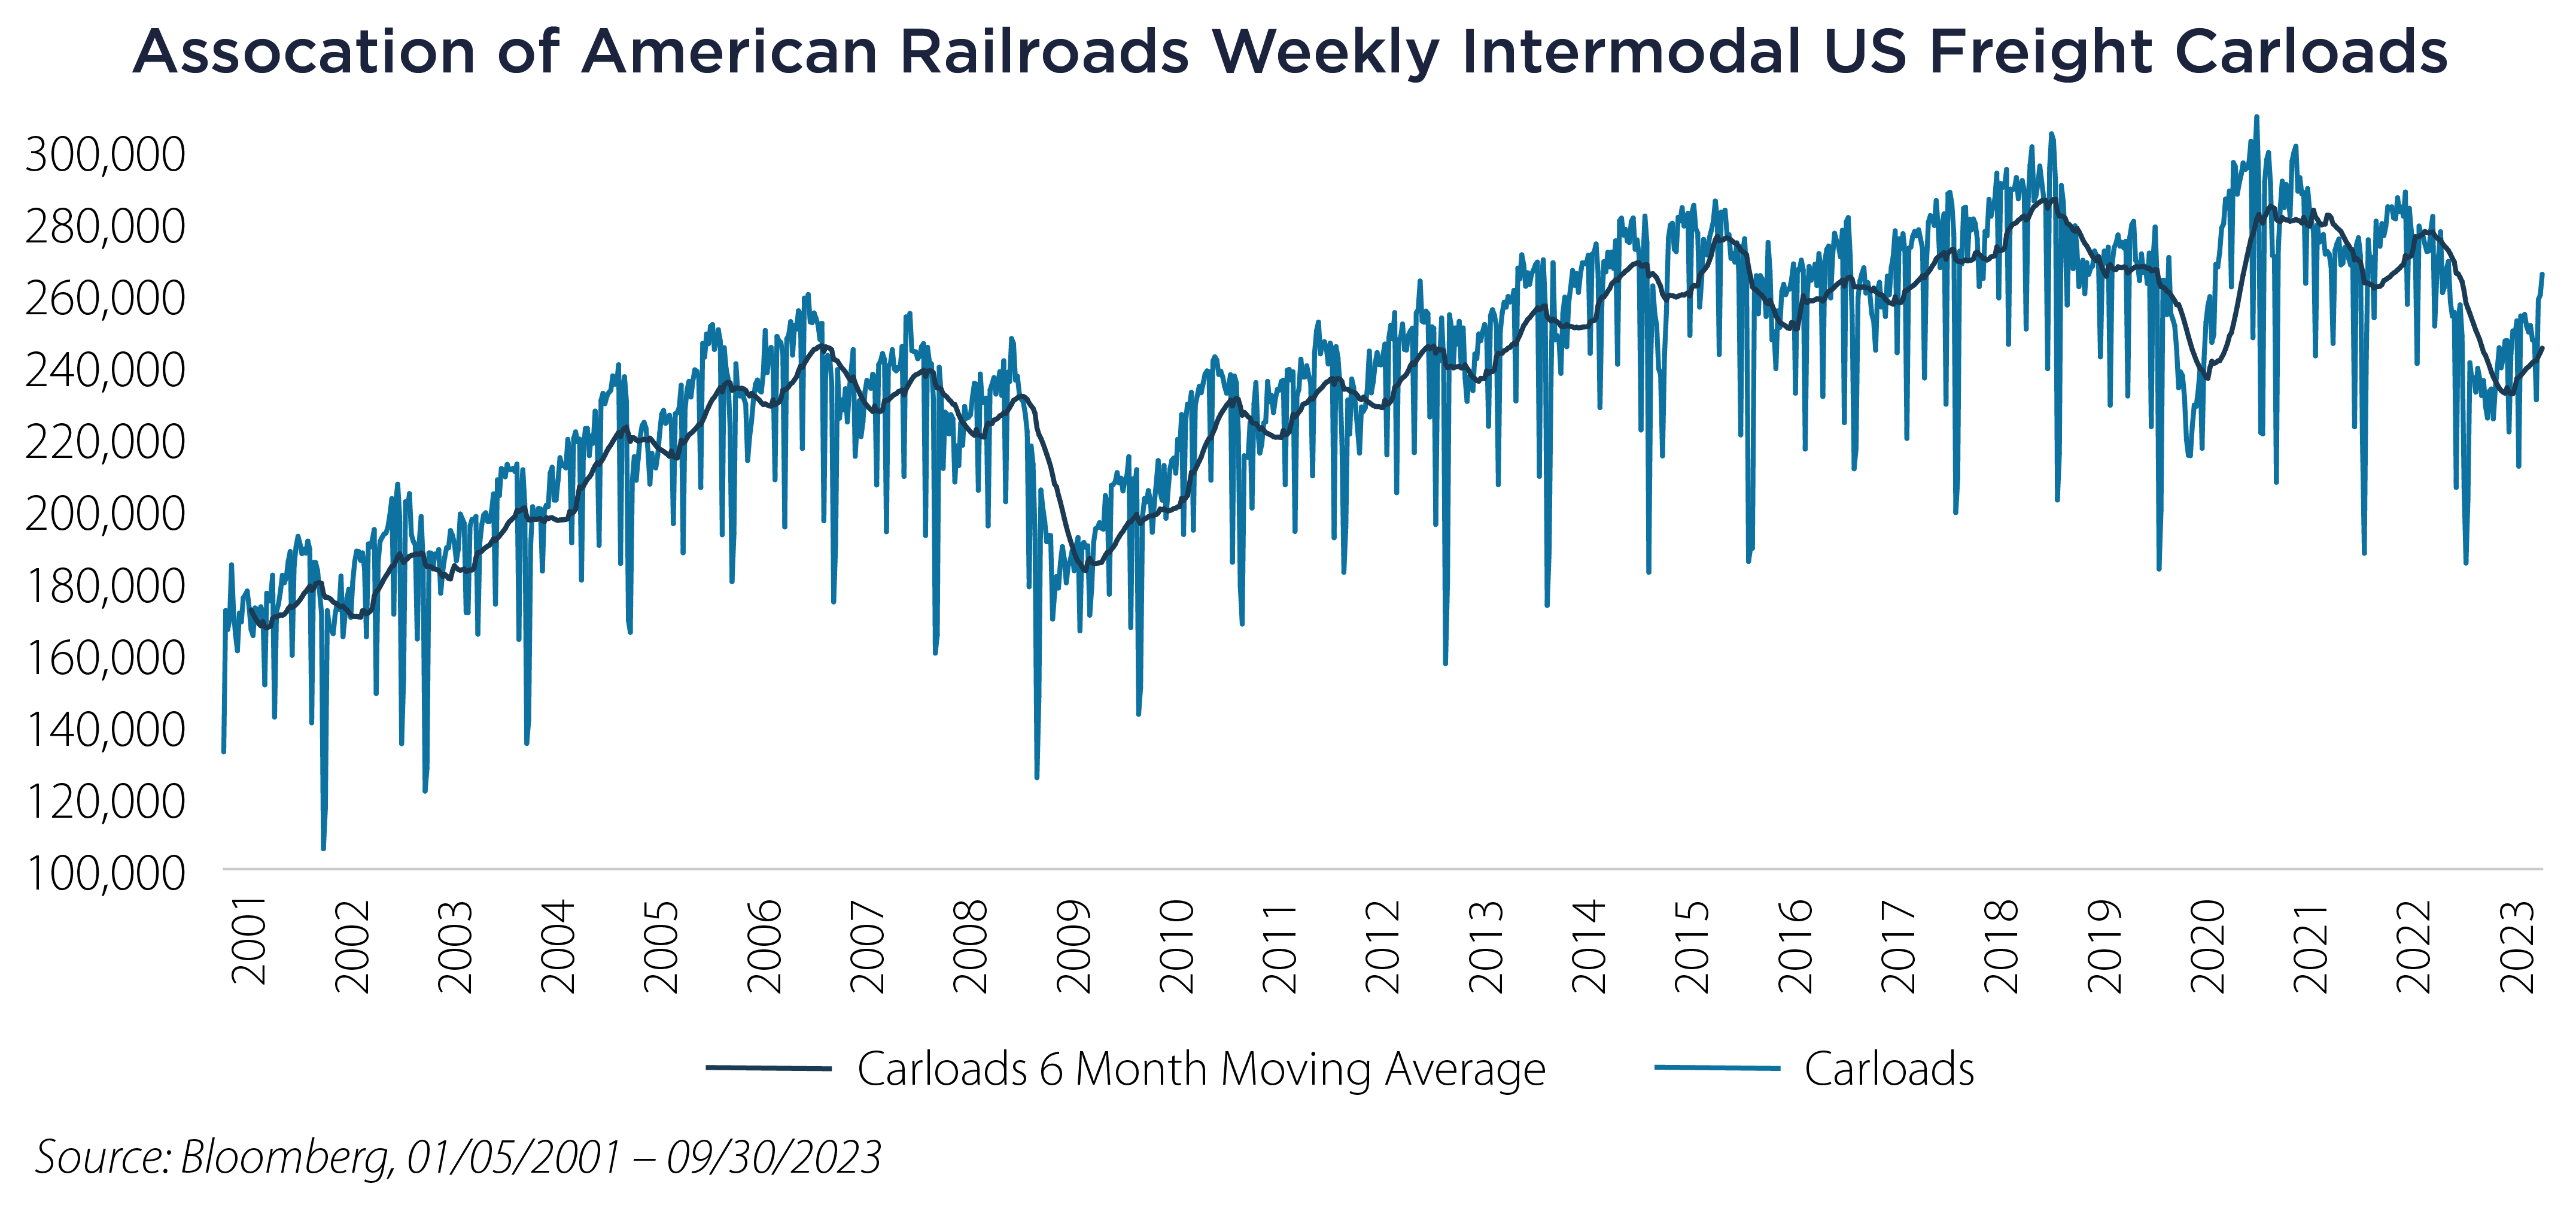
The Structural Cycle
When performing analysis of sequential cycles in business sentiment, it’s helpful to contextualize it with longer term structural cycles. Our goal is to determine the regime dictated by major economic forces and how it may sustain inflection points in sequential sentiment. The three economic forces we look at are as follows:
1. The Wealth Effect
2. The Labor Market
3. US Fiscal Policy
The Wealth Effect
The Federal Reserve releases wealth distribution data from its Distributional Financial Accounts database in which we can examine US consumer balance sheet in cohorts with marginal spending capacity. One clear observation is that wealth accumulation across the board is above trend and rising, driven mostly by real estate, consumer durable goods and investment accounts.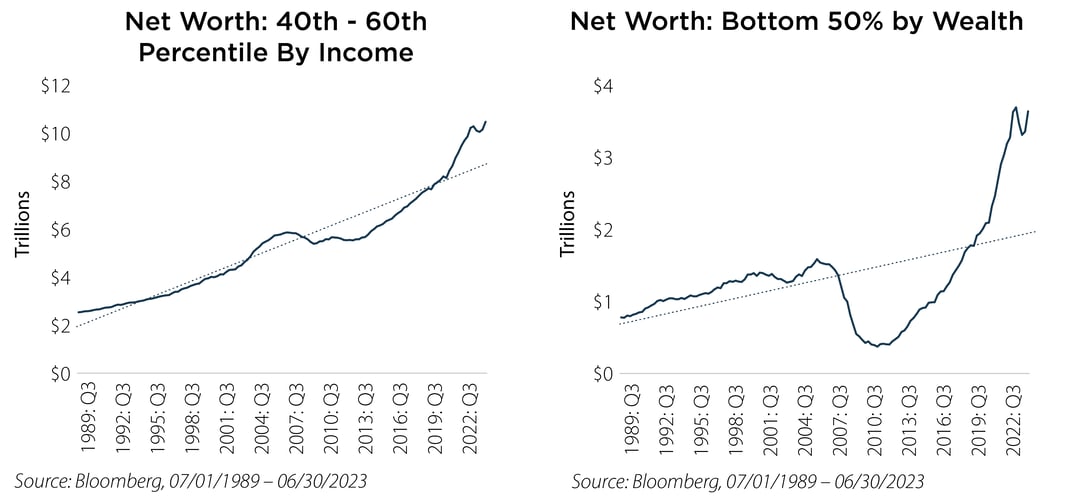 The wealth effect has been especially pronounced in the bottom 50% of net worth. It took 15 years for this cohort to double its net worth in the 1990s and 2000s. It then lost twice that gain in the Great Financial Crisis (“GFC”) and didn’t recover to its pre-GFC trend until the end of 2018. As of the end of 2022 it doubled its net worth in just four years. We expect to see higher figures in 2023.
The Labor Market
The labor market is gradually softening but it’s still tight and the wealth effect is supported by income growth. Non-Farm Payrolls have averaged 272,000 jobs added per month over the last year, hitting their low in June at 105,000 jobs added. According to the Atlanta Fed Wage Tracker, wages in aggregate are still growing at 5% as they continue to normalize from a high of 7.4% in June of 2022.
US Fiscal Policy
United States fiscal deficits as predicted by the Congressional Budget Office are expected to average 6% over the next couple of years, growing at a rate of about 15%. With government spending at 25% of gross domestic product (GDP), the deficit growth alone should add nearly 4 points to GDP. We see this coming through explicitly in fiscal-driven construction spending in the manufacturing and infrastructure sectors. 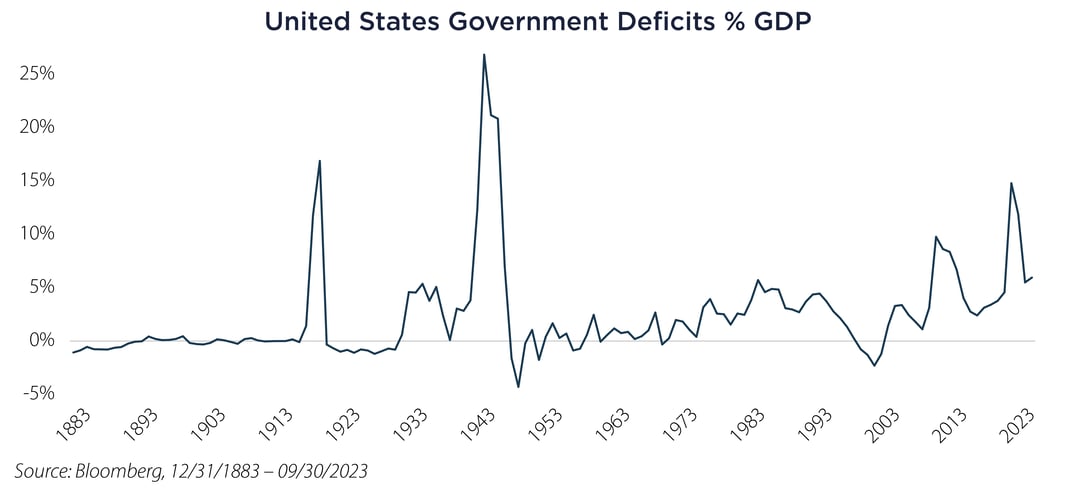 Final Thoughts
Without the financial markets “breaking” as they did in the GFC, an economic slowdown is going to be dependent on demand destruction from higher long-term interest rates taking their toll on interest rate-sensitive demand. The direct way for this to occur is through the labor market (layoffs). The indirect way is via asset price declines. The cycle generally ends when these occur at the same time in a self-reflexive way.
With households and corporates terming out their debt at all-time low interest rates and now receiving risk-free interest income on cash at levels more than twice those seen in the last cycle, they appear less susceptible to the recent rise in interest rates. The marginal improvement in sequential business cycle sentiment and activity shown above corroborates this observation.
In summary, the structural cycle qualities appear robust enough to support an inflection higher in sequential business cycle sentiment. As we continue to watch incoming data that might prove our outlook otherwise, the recent inflection gives us incremental confidence to maintain exposure to risk assets, particularly to segments that would benefit from a more sustainable global economy.
Important Disclosures & Definitions

ISM Manufacturing Inventories Index: a monthly indicator of US inventory levels. A reading over 50 shows inventories have risen from the previous month while a reading below 50 shows a decline in inventories.

ISM Manufacturing New Orders Index: shows the number of new orders from customers of manufacturing firms reported by survey respondents compared to the previous month. A reading over 50 shows orders have risen from the previous month while a reading below 50 shows a decline in orders.

ISM Manufacturing PMI: measures the change in production levels across the US Economy from month to month.
One may not invest directly in an index.

AAI000585  10/17/2024