-    We see compelling evidence of gold’s diversifying power when added to the traditional 60/40 portfolio, with an increase in the Sharpe ratio and an improvement in the max drawdown.

-    Our interest in gold’s demand story persists, as central bank buying may be on an up-trend, and economic growth in India may rapidly expand demand in the country that already accounts for 25% of gold jewelry demand.
The Portfolio Story
In April 2023, we wrote a piece concerning gold as titled “When Gold Gets Interesting.” In this piece, we compared gold’s one-day performance to that of the S&P 500 to explore the theory that gold is a safe haven asset. While perhaps relevant for short-term traders, most investors will be interested in a longer-term, more holistic view of gold’s contribution in a portfolio.
Looking at the last 30 years, stocks and bonds have a correlation of 0.21, which is similar to the correlation of bonds and gold at 0.22. However, stocks and gold have a correlation of -0.01. This low correlation indicates diversification benefits in the combined portfolio, which we see by simulating a portfolio with 5% moved from both stocks and bonds into gold.
| Return | Std. Dev. | Sharpe | Max Drawdown | |
| 60% Equities, 40% Bonds | 8.12% | 9.52% | 0.44 | -33% |
| 55% Equities, 35% Bonds, 10% Gold | 8.08% | 8.98% | 0.47 | -29% |
Source: Bloomberg and SS&C ALPS Advisors, monthly returns from 01/31/1994 - 12/31/2023
Annualized returns and standard deviations shown.
Returns for equities and bonds were modeled using the S&P 500 and the Bloomberg US Aggregate Bond indices, respectively.
The risk-free rate used was the yield on the 10-year US Treasury on 12/29/2023: 3.89%.
Past performance is no guarantee of future results.
Our portfolio’s return did decrease by a small amount, but there was a much more significant reduction in the portfolio’s standard deviation, resulting in a notable increase in the Sharpe ratio. Perhaps even more interesting is the reduction in the portfolio’s max drawdown. These results reinforce the hypothesis that gold may be a useful tool in reducing risk, particularly in times of stress.
The Demand Story
Central bank buying, which we referenced in the prior piece as well, saw a significant spike around Russia’s invasion of Ukraine, and has recently surged again. It is possible this will expand as unfriendly countries grow gold reserves in response to what has been termed “weaponization of the dollar” after Russia’s invasion of Ukraine. While we aren’t ready to jump on the de-dollarization bandwagon, we do find merit in the hypothesis that the unipolar world order may be coming to an end, and governments around the world may begin expanding reserves that are not tied to a specific country. 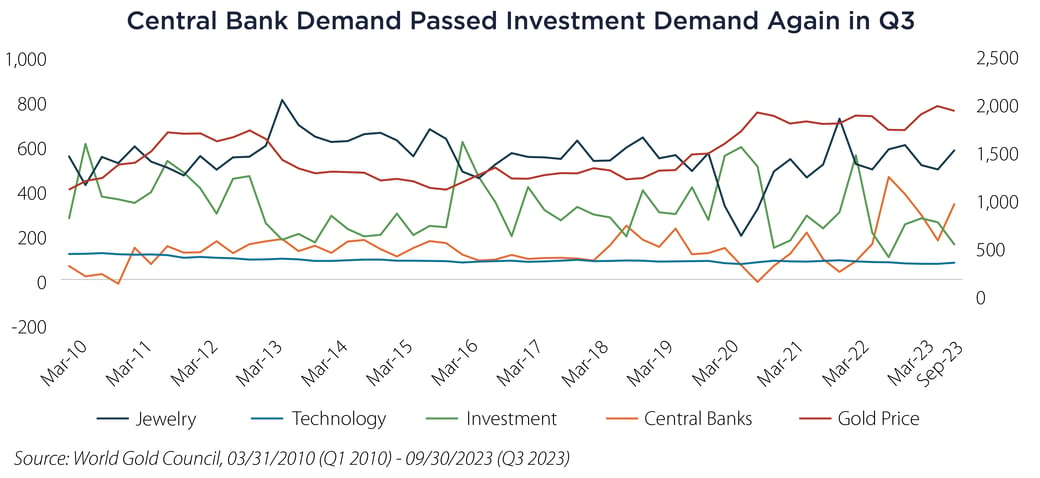
An even more significant and equally resilient source of demand is jewelry, which saw a dramatic pullback during COVID-19 but has since recovered even as prices have remained near historic highs. One important source of gold demand for jewelry is India, where gold holds much cultural significance. Although current gold consumption per capita is relatively low in terms of grams, at 0.55g/person vs. the US at 0.75g/person,1 GDP per capita in India is just over $2,000 vs. $63,000 in the US.2
If China does cede its throne as global manufacturing powerhouse to India, as many have predicted in recent years, rapid growth in India’s economy could translate to a similarly rapid climb in gold demand from the country that was already the single largest source of demand for gold jewelry in 2022.3
Important Disclosures & Definitions

1 Source: World Gold Council, as of 2022

2 Source: World Bank, as of 2022

3 Source: World Gold Council

Bloomberg US Aggregate Bond Index: a broad-based benchmark that measures the investment grade, US dollar-denominated, fixed-rate taxable bond market. The index includes Treasuries, government-related and corporate securities, fixed-rate agency MBS, ABS and CMBS (agency and non-agency).

Maximum Drawdown (MDD): a measure of an asset's largest price drop from a peak to a trough. Maximum drawdown is considered to be an indicator of downside risk, with large MDDs suggesting that down movements could be volatile.

S&P 500 Index: widely regarded as the best single gauge of large-cap US equities. The index includes 500 leading companies and covers approximately 80% of available
market capitalization.

Sharpe Ratio: a measure that indicates the average return minus the risk-free return divided by the standard deviation of return on an investment.

Standard Deviation: a statistical measure that indicates the extent of deviation for a group as a whole.

One may not invest directly in an index.

AAI000562 01/16/2025