


-
Most retirement plans anchor to individual life expectancy, but the joint survival probability for couples extends the effective planning horizon by nearly six years beyond even the longer-lived spouse’s individual expectancy.
- The surviving spouse faces a retirement phase that is longer, more expensive per capita, and funded by a smaller income stream than plans based on individual life expectancy may assume.
- Planning to the median rather than the tail systematically underfunds late retirement, with implications for withdrawal rates, asset allocation, and the equity glide path.
Consider a wife aged 60 whose husband is 62. Her life expectancy is 24.4 years; his is 20.2. The intuition that the longer-lived spouse will only outlive their partner by a couple years is incorrect. Compton and Pollak (2019) demonstrate that using individual life expectancies to calculate planning horizons for couples yields materially misleading results, because the mortality distributions of husbands and wives overlap far more than most people assume.1
For the focal couple used by Compton and Pollack (2021),2 the joint life expectancy is 17.7 years. The probability that the wife outlives her husband is 0.63, and if she does, her expected survivor period is 12.5 years. The total effective planning horizon is therefore not 24.4 years, but 30.2: 17.7 years of joint retirement followed by 12.5 years in which the surviving spouse is alone.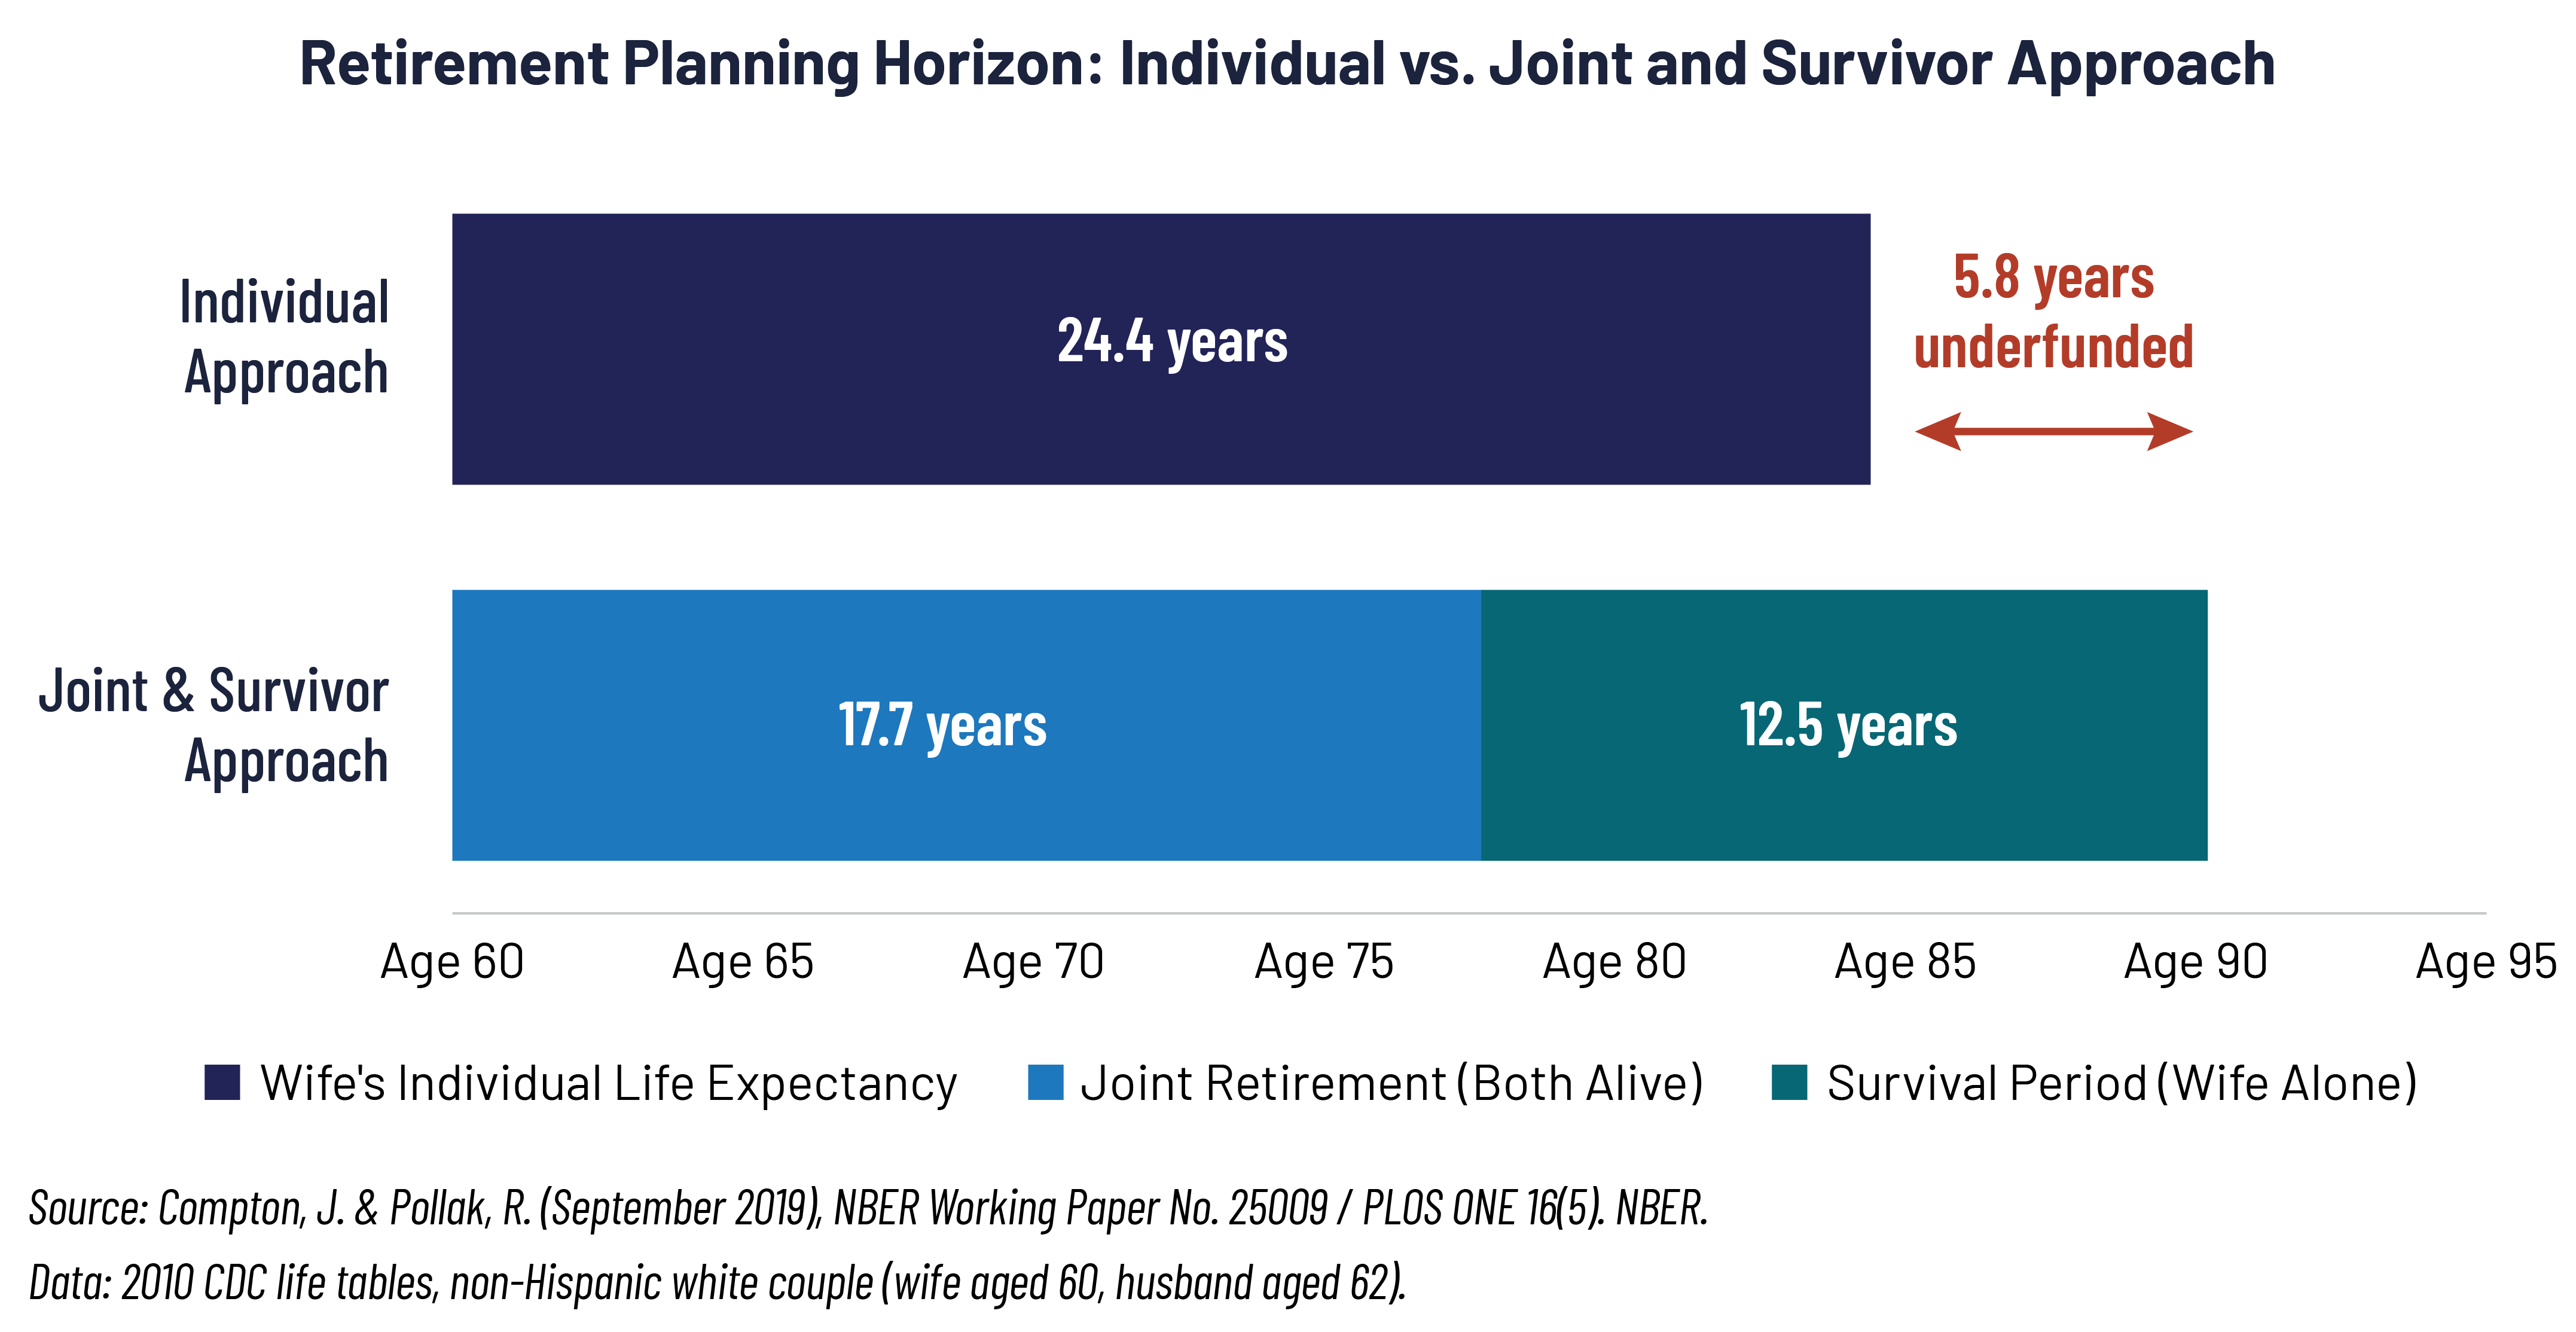 The gap of nearly six years represents an entire phase of retirement that a plan anchored to individual life expectancy does not account for. The error stems from the assumption that if one spouse’s life expectancy is 24 years and the other’s is 20, the couple can plan as though they will die a few years apart. In reality, life expectancy is just a midpoint on a distribution of possible outcomes, and the dispersion around this summary measure is large enough that planning to the median leaves a substantial probability of outliving the plan.3
Blanchett (2021) reaches a similar conclusion using the Society of Actuaries/Academy Longevity Illustrator. For a couple, both 65 years old, both non-smokers in average health, the median survival period for at least one member is 27 years, seven years longer than the husband’s individual median of 20 years and four years longer than the wife’s individual median of 23 years.4 At the 25th percentile of survival probability, the “at least one alive” figure extends to 31 years.
The length of the survivor phase is only part of the problem. The economics of that phase are less favorable than most plans assume.
The Survivor Phase Is Harder Than It Looks
An intuitive rebuttal is that the surviving spouse inherits the deceased spouse’s share of the portfolio, effectively doubling per-capita assets. This framing is incomplete for several reasons.
First, the survivor period is not brief. At 12.5 years in expectation, it constitutes more than 40% of the total 30.2-year planning horizon. The portfolio that funds this phase has already sustained 17.7 years of withdrawals.
Second, expenses do not halve when a spouse dies. Housing, property taxes, insurance, and utilities are largely fixed. Healthcare costs tend to rise in later years, particularly as long-term care becomes more likely. A surviving spouse will likely require well above the 50% that the “inherited portfolio” intuition implies.
Third, Social Security income drops. The surviving spouse retains the higher of the two benefits but loses the lower one, which can represent a meaningful reduction in household Social Security income at a point in retirement when the portfolio is already materially depleted.5
The survivor phase is therefore characterized by a smaller income stream, a partially depleted portfolio, largely unchanged fixed costs, and rising healthcare expenses. And this is the phase most likely to be underfunded by a plan that anchors to individual life expectancy.
Implications for Asset Allocation
If the effective planning horizon for a couple extends to 30 years or more, this has direct implications for asset allocation. Research by Pfau and Kitces (2014) found that portfolios beginning retirement with roughly 30-40% in equities and gradually rising to 60-80% over two decades had a lower probability of failure than traditional declining glidepaths.6 A conservative early-retirement allocation limits exposure to sequence-of-returns risk, while increasing equity exposure later captures the growth needed to sustain a longer withdrawal period.
The longevity data presented here strengthens that case. A portfolio that must fund a survivor phase extending into the plan holder’s early 90s cannot afford to be entirely de-risked by the time the first spouse dies.7 The years following the first death are precisely when equity exposure may be most needed, as the portfolio faces a long remaining horizon and a low remaining balance.
This doesn’t mean that every couple should plan to age 100. It simply means that anchoring to individual life expectancy, or worse, to a single “average” retirement length, introduces a systematic bias that compounds quietly over decades. Advisors who incorporate joint survival data into the planning conversation are better positioned to set defensible horizons and make a more robust argument for the asset allocation their clients will need.
Important Disclosures & Definitions

1 Compton, J. & Pollak, R. (August 2019). The Life Expectancy of Older Couples and Surviving Spouses. IZA Discussion Paper No. 12571. SSRN.

2 The paper focuses on the example of a non-Hispanic white wife aged 60 and husband aged 62. The paper includes analysis of other demographics and concludes the issue of underfunding when planning to individual life expectancy is similar across the groups analyzed.

3 Compton, J. & Pollak, R. (August 2019). Table 4: Dispersion matrix for a non-Hispanic white couple (wife aged 60, husband aged 62).

4 Blanchett, D. (August 2021). How to Estimate “The End” of Retirement. Journal of Financial Planning, 34(8), 88–99. Estimates obtained from the SOA/Academy Longevity Illustrator for a couple both aged 65, non-smokers, average health.

5 Social Security Administration. Survivors Benefits. SSA.

6 Kitces, M. & Pfau, W. (2014, September 16). Retirement Risk, Rising Equity Glidepaths, and Valuation-Based Asset Allocation. SSRN.

7 To be conservative, the plan would ideally extend beyond the plan holder’s early 90s based on the 25th percentile of survival.

AAI001168