

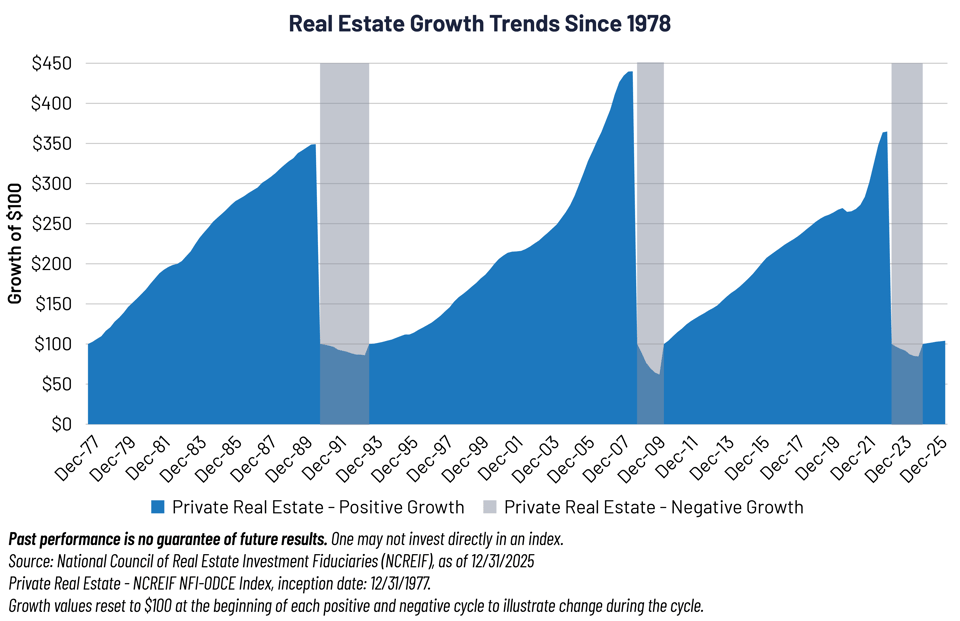
Since 1978, commercial real estate has delivered three distinct multi-year growth cycles: 1978–1989, 1994–2007, and 2010–2022. Each cycle lasted roughly 13 years on average and produced annualized total returns of approximately 10%. The intervening correction periods were much shorter—typically two years—but sharp, with average peak-to-trough drawdowns of about 22%.
Each cycle was powered by its own distinct tailwinds:
-
1980s: Savings and Loan (S&L) deregulation and high inflation that drove demand for hard assets.
-
1990s–2000s: Explosive growth of commercial mortgage-backed securities (CMBS) securitization and large foreign capital inflows.
- 2010s: Zero Interest Rate Policy (ZIRP) and a once-in-a-generation surge in e-commerce and logistics demand.
A New Growth Cycle?
Private real estate has now posted six consecutive quarters of positive returns, and public Real Estate Investment Trusts (REITs) are up 7.5% YTD,1 highlighting an important consideration: are conditions emerging for a fourth growth cycle—or are we just in the early phase of a more modest recovery?
Three important factors that are encouraging right now:
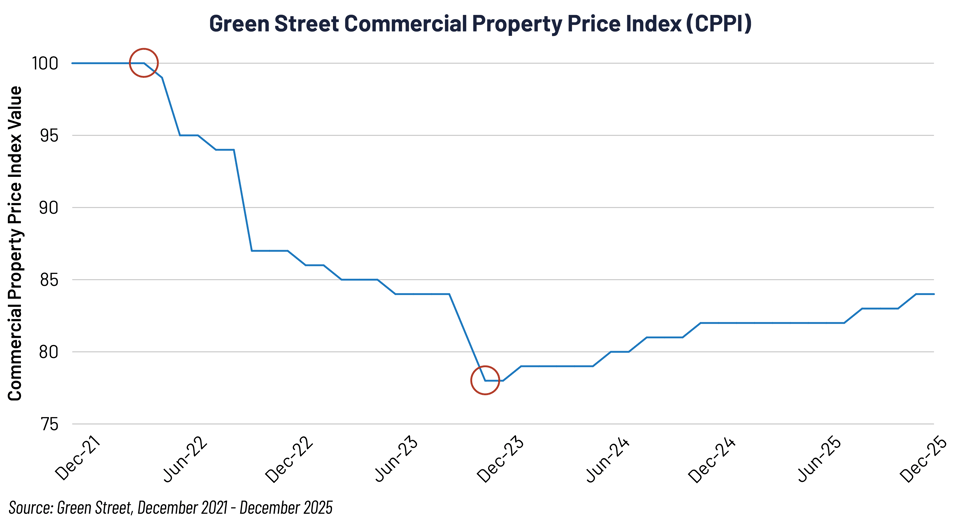
1. Property values have reset and are now in the early stages of recovery. According to Green Street, prices are down 16% since the April 2022 peak and up 7% since the November 2023 trough.
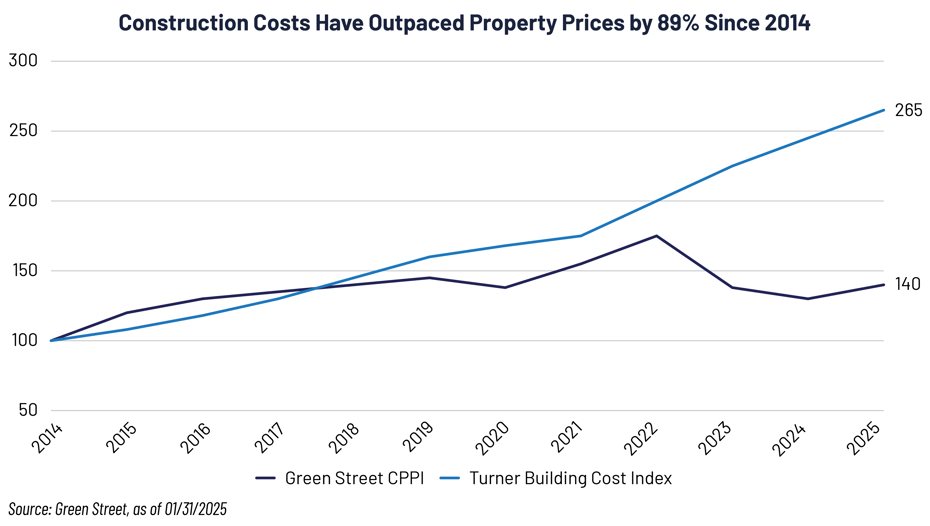
2. Fundamentals are solid and new supply growth is drying up. Net operating income, dividends and occupancies are generally healthy. At the same time, as highlighted below, much higher construction and replacement costs have slowed new building sharply—which is helping support rents and lift the value of existing properties.
3. Valuations look compelling on a relative basis. Public real estate is trading at one of the cheapest earnings yields compared to the S&P 500 Index in nearly 20 years.
Commercial real estate (CRE) represents approximately 16% of the total US investable market,2 making it the third-largest asset class in the US. Yet the real estate sector accounts for just 2.3% of the S&P 500.3 As a result, many investors are significantly underweight this important diversifier.
CRE offers three powerful characteristics that can improve attractive risk-adjusted returns with controlled drawdowns:
-
Reliable income—predictable rental cash flows that often exceed both bond yields and dividend stocks.
-
Secular growth—long-term capital appreciation driven by population trends, urbanization and structural demand shifts (especially data centers, logistics and residential housing).
-
Inflation protection—rents and property values that typically rise with (or ahead of) inflation, particularly in leases with consumer price index (CPI) escalators or periodic market resets.
In short, whether or not this marks the beginning of a new multi-year growth cycle, the 16% value reset, healthy fundamentals, declining supply and attractive relative valuations support a selective allocation to capture CRE’s reliable income, asset growth and inflation protection.
Important Disclosures & Definitions

1 Source: Morningstar, FTSE NAREIT All Equity REIT Index, 12/31/2025 – 2/12/2026.

2 Bonds source: SIFMA, FRED Database and Structured Finance Association, latest available as of 12/31/2025; Equities source: World Federation of Exchanges, latest available as of 12/31/2025; Commercial Real Estate source: Federal Reserve, Financial Stability Report, latest available as of 12/31/2025; Cash source: Securities and Exchange Commission, latest available as of 12/31/2025.

3 State Street, as of 12/31/2025.

Green Street Commercial Property Price Index (CPPI): a time series of unleveraged US commercial property values that captures the prices at which commercial real estate transactions are currently being negotiated and contracted. Features that differentiate this index are its timeliness, its emphasis on high-quality properties, and its ability to capture changes in the aggregate value of the commercial property sector.

Tailwind: a certain situation or condition that may lead to higher profits, revenue or growth.

The Turner Building Cost Index: a widely recognized, quarterly, nationwide index tracking non-residential construction costs in the US for over 80 years. It measures labor rates, productivity, material prices and market conditions to reflect cost trends. It is commonly used to forecast, estimate, and analyze market price change.

S&P 500 Index: widely regarded as the best single gauge of large-cap US equities. The index includes 500 leading companies and covers approximately 80% of available market capitalization.

One may not invest directly in an Index.

AAI001104