

Gold has recently been all over the financial press, as investors have bid up the price of the metal substantially in the past several months. The chart below shows the performance of gold over the past 50 years.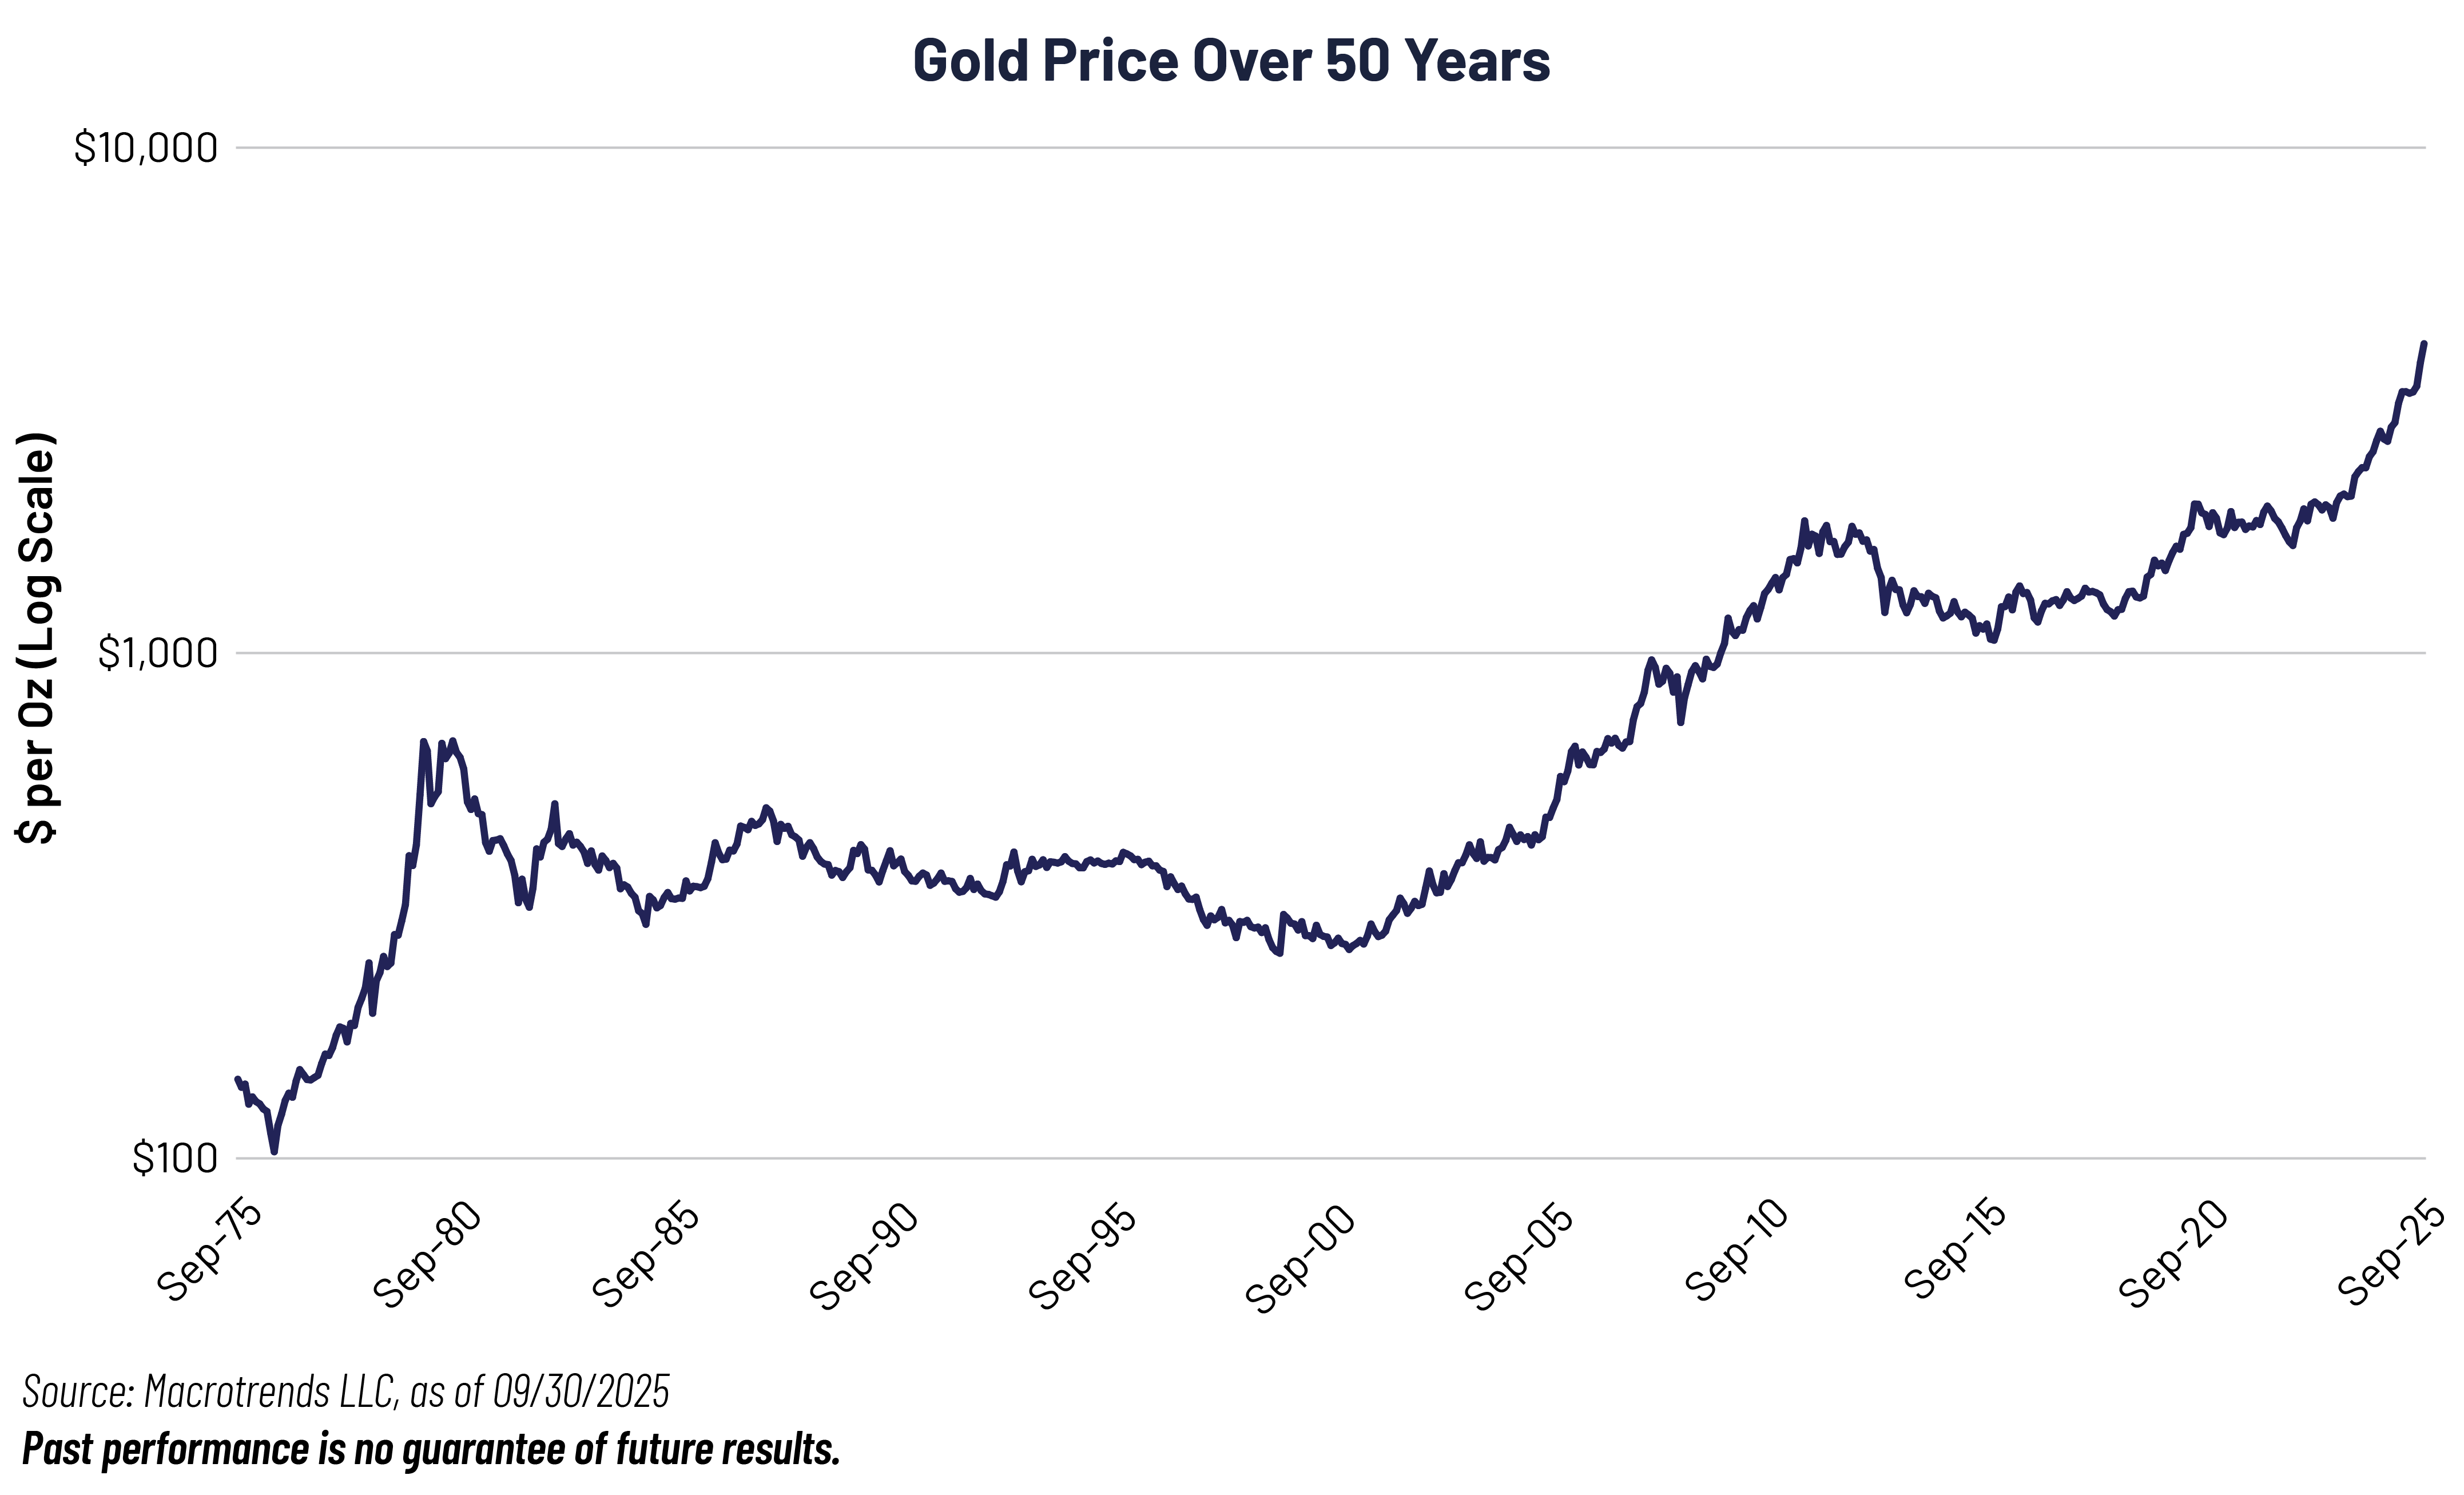 The price of gold first hit $1,000/oz at the onset of the Global Financial Crisis and gradually doubled to $2,000/oz over the subsequent 15 years. From the end of 2023, it has taken less than two years for gold to double again to just over $4,000/oz.
A weaker dollar, trade uncertainty, global conflicts and lingering inflation provide a tailwind for interest in gold. Add to that the fact that central banks have been adding gold to their reserves and most expect that trend to continue, with bankers preferring gold to dollar reserves going forward. This dynamic could lead to ongoing demand.1
Because gold does not generate cash flow, it has been difficult to value using traditional methods. But for investors concerned about continued weakness in the dollar, sticky inflation, lower Treasury yields and continued geopolitical uncertainty, it could provide a hedge against these risks.
As we write this (on 10/22/2025), gold is currently suffering a pullback of about 5%, one of the largest single day moves in the metal in the past several years. So, is this the beginning of a new trend in the gold price, or is this a buying opportunity? Time will tell, but for the moment gold has captured the attention of investors.
Important Disclosures & Definitions

1 World Gold Council. (06/17/2025). Central Bank Gold Reserves Survey 2025.

Tailwind: a certain situation or condition that may lead to higher profits, revenue or growth.

AAI001023