

Summary
Fixed Income Investments are an important component of a multi-asset portfolio. These investments are designed to provide varying levels of total return, income, capital preservation, portfolio diversification and liquidity. In order to best ensure these objectives can be achieved, a disciplined framework must contain processes that can assess, monitor and adapt to the major risks and market conditions that impact fixed income investments.
The SS&C ALPS Advisors Fixed Income Framework includes both quantitative and qualitative analysis to assess these risks with the goal of positioning portfolios to achieve better risk-adjusted returns. Implicit in this process is the notion that the market consensus is not always correct and constantly evolving, both of which require independently monitoring economic, policy and market developments. The Framework has flexibility to update its inputs based on the SS&C ALPS Advisors’ Research Team’s views.
The framework process provides return estimates and recommended positioning for the following 12 month period, and can be summarized as follows:
- Research Team assesses the current fixed income landscape and forecasts 1-year forward base-level returns.
- We evaluate macroeconomic data in the context of Federal Reserve policy and develop likely economic scenarios.
- We examine the yield curve and its progression to ascertain what scenario(s) the market has priced in.
- We monitor portfolios utilizing both the framework’s primary quantitative risk outputs and Research Team views and recommend changes as conditions warrant.
| Framework Process | Description | Primary Risks Assessed |
| I. Baseline Sector Return Forecasts | Disaggregates passive market indices to establish baseline sector-level expected 1-year forward risk/returns. Updated quarterly. | Market Duration, Yield Curve and Credit Risks |
| II. Economic Cycle and Policy Analysis | Continuous analysis of real time economic data and policy guidance forms evolving economic scenario probabilities which impact the projected rate cycle and credit outlook. | Interest Rate, Inflation, Policy, Reinvestment and Credit Risks |
| III. Market Expectations and Implications | Continuous evaluation of the market’s implied rate path versus internal analysis can drive strategic and tactical positioning among Rate and Credit sectors. | Volatility, Liquidity, Yield Curve and Spread Risks |
| IV. Positioning and Monitoring | Combines the outcomes of the primary risk assessments and Research Team views to recommend sector (“Building Block”) weights, duration and yield curve positioning and any desirable Factor exposures. | Performance, Factor and Tilt Risks |
I. Baseline Sector Return Expectations (Forecasting)
Our forecasting framework begins by establishing an expected baseline return for core bond sectors, as represented by the Bloomberg Aggregate Bond Index, and major non-core sector indices such as High Yield, Municipal, etc. The baseline return uses sector Yield-to-Maturity (YTM) as an approximation for the 1-year forward Expected Return (Ra). This first step allows for a comparable starting point to analyze market cap weighted Index and sector component expected returns versus their respective interest rate sensitivity (“duration”):
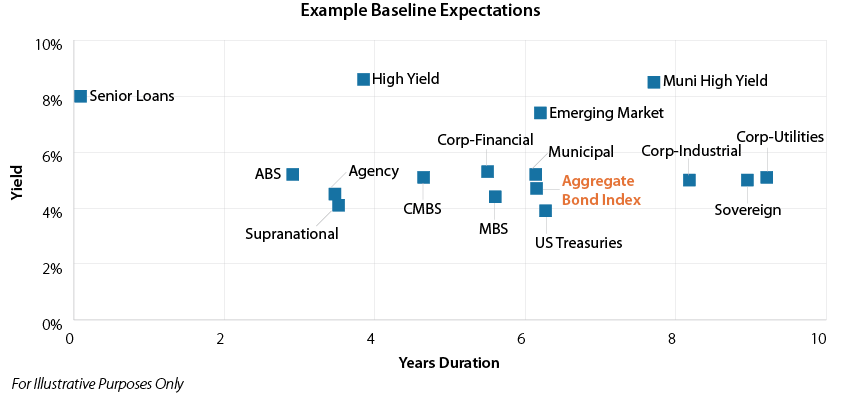 This baseline data is a static estimate and updated quarterly. When combined with risk statistics, such as the sector standard deviation of return, an expected range of returns can be assigned with varying confidence levels.
This range estimate of returns is then enriched by the Research Team to include market implied rate change projections and independently derived “what if” scenarios (discussed in the following sections). These provide a dynamic estimate of baseline sector returns. These adjustments may include real or anticipated changes in:
- The Risk Free Rate (Treasury spot curve)
- The Yield Curve Shape (Steepening or Flattening)
- Credit Spreads (Tightening or Widening vs. Treasuries)
- Sector Betas (Correlations to market returns)
- Sector Specific Event/Factor Adjustments
II. Economic Cycle and Policy Analysis
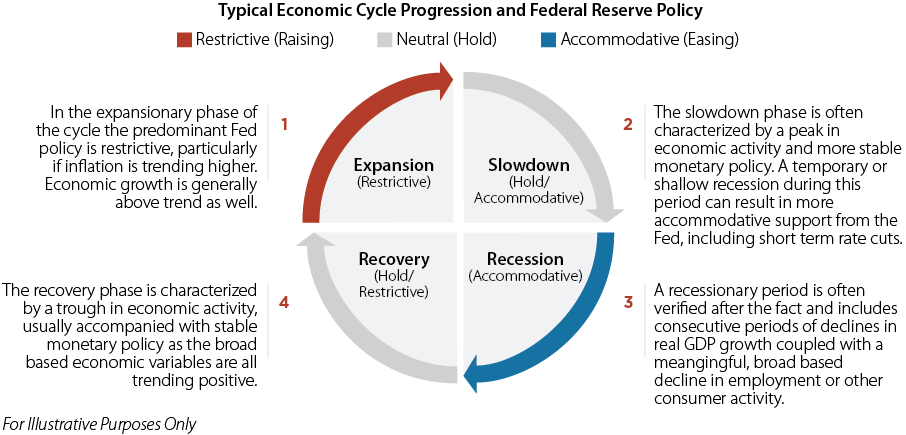
Understanding where we are in any economic cycle and directionally where the economy is headed is an ongoing component of formulating fixed income strategy and positioning. This is because certain sectors, bond types and tenors perform differently in different stages in the cycle. However, just as important is understanding the Federal Reserve’s policy reaction function to the incoming economic data. The graphic presented below shows the typical economic cycle and monetary policy status through a full cycle. The policy reaction function may be greater or less than the market expects, which is a major source of shorter term volatility. The graphic below presents the typical economic cycle progression along with the predominant monetary policy regime:
 Economic Scenarios and Policy Assessment
Monitoring incoming economic data is an important function of the Research Team. The Research Team follows a host of important macro-economic variables and Federal Open Market Committee (FOMC) releases to independently assess where we believe we are in the cycle. Additionally, the Team tracks trends in the data to support an independent assessment of what range of economic scenarios may unfold (over the same time period (1 year) as the baseline return projection). Some of the more important macro variables and Fed releases the Research Team follows are:
- Inflation: Core PCE, CPI and PPI, Sticky CPI
- Unemployment: Unemployment Rate, Non-Farm Payrolls, Participation Rates
- Business Activity: Durable Goods, ISM PMIs, ISM Services
- Consumer Activity: Retail Sales, Consumer Sentiment, Personal Income/Spending
- Federal Reserve: FOMC Economic Projections, “Dot Plots”, FOMC Minutes
Based on the data analysis, the Team independently assigns confidence levels for likely economic scenarios. To help frame the policy response we demarcate the scenarios with key macroeconomic trends. This helps to answer some of the critical questions in portfolio construction in the next section. The chart below illustrates a high level example of this part of the Framework.
| Economic Scenario Developing (1 year forward) |
Probability Assignment |
Core PCE | Unemployment | Real GDP | Policy Assessment |
| Variable Trend Projection | Level/Trend | Level/Trend | Level/Trend | Hold/Restrictive/ Accommodative |
|
| Expansion | XX% | Continues to trend higher from lower levels |
Continues to trend lower | Well Above Trend | Restrictive |
| Slowdown | XX% | Levels out and/or begins to fall | Stable to increasing unemployment | Below Trend | Hold/Accommodative |
| Recession | XX% | Falling trend | Increasing unemployment | Well Below Trend | Accommodative |
| Recovery | XX% | Levels out and/or begins to rise | Stable to decreasing unemployment | Above Trend | Hold/Restrictive |
For Illustrative Purposes Only
III. Market Expectations
The third leg of the Framework focuses on the yield curve and its cycle progression, as it contains not only information about the future path of interest rates but also the price for accepting the market’s view. Fed policy, by its very nature, relies in large part on a set of imperfect, backward-looking data to provide future estimates. As a result, market participants often view the Fed as “behind the curve” and attempt to position ahead of expected action in order to capture excess returns. Again, the market consensus is not always correct, but challenging the market consensus is what drives strategic and tactical positioning, based on our own views of rate levels and cycle progression.
Yield Curve Cycle Progression
The normal shaped yield curve is upward sloping, reflecting the time value of money and to compensate investors for the higher volatility of longer maturity investments. Humped and Inverted yield curves are abnormal and transitional, reflecting uncertainty over economic conditions, monetary policy and/or future growth prospects (recessions and expansions). The following chart shows the typical progression as a yield curve eventually reverts to normal expansionary starting point. Certain sectors have performed better than others in different yield curve environments as shown below.
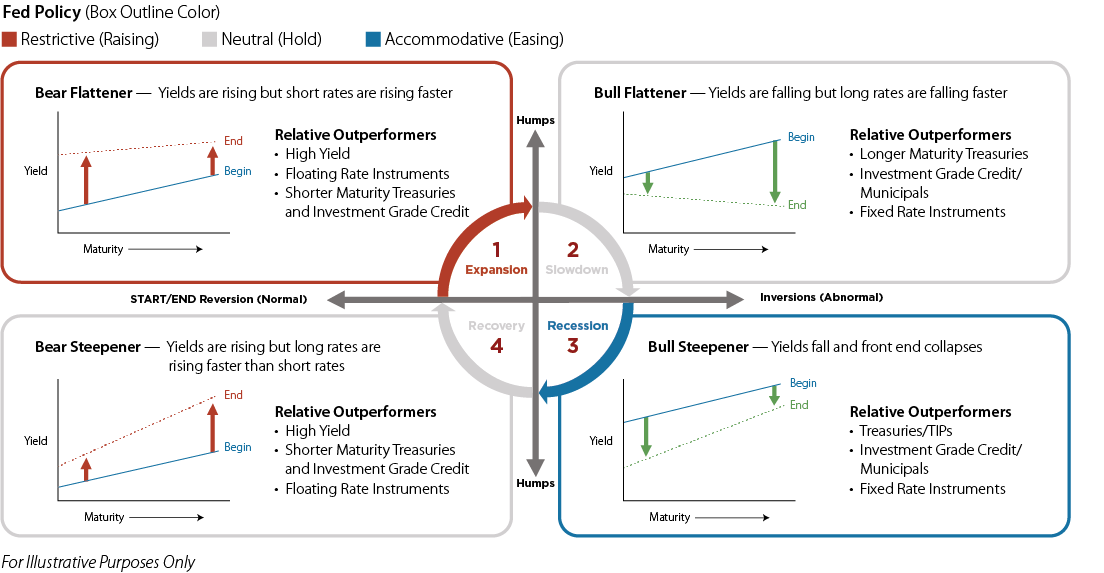 In the above example, the yield curve shape reveals which economic scenario is priced to unfold (the “markets’ view”), typically within a 2-year time frame. Empirical evidence has demonstrated that while the yield curve shape is a reliable indicator of future economic activity (particularly with respect to the inverted yield curve and recession odds), the Research Team primarily focuses on the actual yield curve spread between short and long Treasury securities. For example, the spread between the 2-year zero coupon Treasury and 10-year coupon Treasury gives information on both the expected pace and magnitude of short-term monetary policy expectations, but also terminal rates, investor sentiment and a proxy on actual borrowing and financing costs. In a larger sense, this relationship has implications for fixed income duration and credit sector (spread) positioning described below.
Forward Rates (Duration) Positioning
Following the yield curve progression, presented below is a typical summary of economic scenarios that may develop over the next 12-24 months. Probabilities are assigned to the market’s forward views based on the level and slope of the yield curve (based on market derived Fed policy rates and Fed Fund futures contracts) to determine the mode, or most likely market scenario. The internal assessment may or may not be as confident in this view, which brings in alternative modes, particularly around the tails of the market view.
| Forward Scenario Developing within 1 year |
Market Probability Assignment |
Internal Probability Assessment | Future Yield Curve Implication |
Strategy | Preferred Duration |
| Expansion | XX% | XX% | Curve shifts upward and gets flatter | Bear Flattener | Short Duration/Market Weight |
| Slowdown | XX% | XX% | Long rates fall and curve may become inverted | Bull Flattener | Long Duration Overweight |
| Recession | XX% | XX% | Curve shifts lower and gets steeper (front end collapses) | Bull Steepener | Long Duration/Market Weight |
| Recovery | XX% | XX% | Curve shifts upward and gets steeper | Bear Steepener | Short Duration Overweight |
Credit Positioning and Valuation
Much as in the case above with varying duration positioning, different credit sectors are typically preferred under different evolving economic scenarios. In general, credit spreads tend to widen (become relatively cheaper versus Treasuries) during times of economic slowdown/recession and tighten (become relatively expensive versus Treasuries) during times of expansion, which may or may not be accompanied by inflation. The same holds true for credit quality. Lower quality securities tend to widen relatively more in recession and tighten more in expansions.
| Selected Major Spread Sectors | General Characteristic(s) | Preferred Rate/Credit Environment |
| Mortgage Backed Securities (MBS) | Most sensitive to changes in rate levels (volatility) | Perform best in falling rate environments |
| Investment Grade Corporates | Sensitive to changes in rate levels (volatility) | Perform better in falling rate environments |
| Municipal Securities | Very low default risk, generally track changes in rates. However, subject to event risk and periods of illiquidity | Perform better in wider spread (credit challenged) environments |
| High Yield | Least sensitive to changes in rate levels given higher coupons | Perform best during rising rate environments |
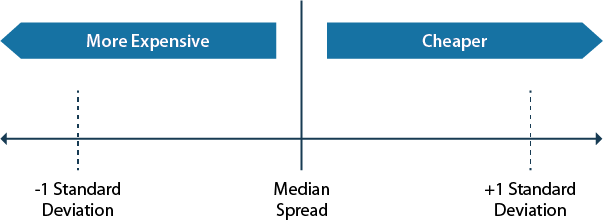
The framework contemplates the above rate impacts to various spread sectors in context of the economic scenario outlook, but also utilizes a simple valuation approach to justify any actual overweight or underweight recommendation versus the market index. The sector’s current credit option adjusted spread (OAS) is compared versus its 10 year standard deviation and OAS history (or a more relevant period depending on the economic regime) to determine relative value historically and versus other competing credit sectors.
 Including this relative value assessment, below is an example showing a preferred credit sector.
| Base Credit Sector |
||||
| Forward Scenario Developing within 1 year |
Internal Probability Assessment | Preferred Quality | Spread Implication | General O/W (Ex-Valuation Adjustment) |
| Expansion | XX% | Average Quality | Tighter | High Yield |
| Slowdown | XX% | High Quality | Wider | MBS/Municipal |
| Recession | XX% | Medium to High | Flat to Tighter | Municipal/Investment Grade Credit |
| Recovery | XX% | Average to Medium Quality | Flat to Tighter | Investment Grade Credit/High Yield |
For Illustrative Purposes Only
IV. Putting it all Together – 2022 Framework Case Study
Entering 2022, the Frameworks’ 2021 Q4 year-end baseline return projection for Core bonds was -1.59% based on the 75 bps of rate hikes built into the curve. Starting yields were low (the Bloomberg Aggregate YTM was only 1.3%) and the Federal Reserve had not yet begun its rate hike campaign. Certain non-core, lower duration sectors had higher return expectations (i.e. senior loans were 4.5%).
While at this time the Framework and qualitative analysis did not foresee the extent to which inflation would increase, it forced us to weight the economic cycle and policy considerations more heavily in the positioning framework. The concurrent inflation (CPI) data at the time was 5%+ and Federal Reserve policy remained in its ZIRP (Zero Interest Rate Policy) while nominal GDP growth was running at 3%+ quarter over quarter after recovering from the pandemic economic shutdown.
The market expectation analysis (yield curve) confirmed the economic cycle and near-term policy response, as the shape of the yield curve was positively sloped (75 bps from 2 years to 10 years). The 2-year zero coupon treasury spot rate had risen 75 bps in anticipation of near-term policy response (rate hikes). However, both Investment Grade and High Yield Option-Adjusted Spreads (OAS) were at their 10-year low (expensive) watermarks, suggesting a continued benign environment for credit.
| Framework Case Study Q4-2021 | Results Summary | Positioning Recommendations |
| I. Baseline Sector Return Forecasts | Negative expected baseline fixed income returns. Lower starting yields and long market durations reduce the attractiveness of market weightings. Longer duration sectors, such as US Treasuries, sovereigns and certain investment grade corporates should be underweighted. | Shorter duration sectors look relatively more attractive but with overall underweight core fixed income |
| II. Economic Cycle and Policy Analysis | Economic cycle clearly in expansionary/restrictive mode but policy behind the curve. Key incoming economic data higher than Fed projections which increases policy risk. Data does not confirm early signal for economic progression to slowdown/recession. | Short Duration Environment favors floating rate and short duration exposure in economic growth scenario, such as High Yield/Loans and ABS |
| III. Market Expectations (Yield Curve and Spreads) | Economic cycle clearly in expansionary with no recession/growth concerns on the horizon. This confirmed a benign environment for credit and market weight duration given yield pickup along the curve. | Market Duration Curve positively sloped and pricing in forward short-term rate hikes, offering yield pickup for longer duration. However, credit sector spreads are expensive, particularly in investment grade credit. |
AAI001056