

The value of the 60/40 portfolio depends on a simple assumption: when stocks fall, bonds rise. For most of the past two decades, that assumption generally held as inflation was low and stable, and bonds cushioned equity drawdowns. Looking deeper, that relationship depends on the inflation environment and the environment has been changing. The 60/40 is still a useful model but as inflation rises, its central assumption becomes less robust.
Stock-Bond Correlation Rises With Inflation
The relationship between stocks and bonds tends to shift as inflation rises. As illustrated below, when three-year inflation ran below 2%, stocks and bonds were essentially uncorrelated. Between 3% and 5%, the average correlation rose to 0.31, and it was positive in 82% of months. Above 5%, it reached 0.46 and was positive in every month we measured.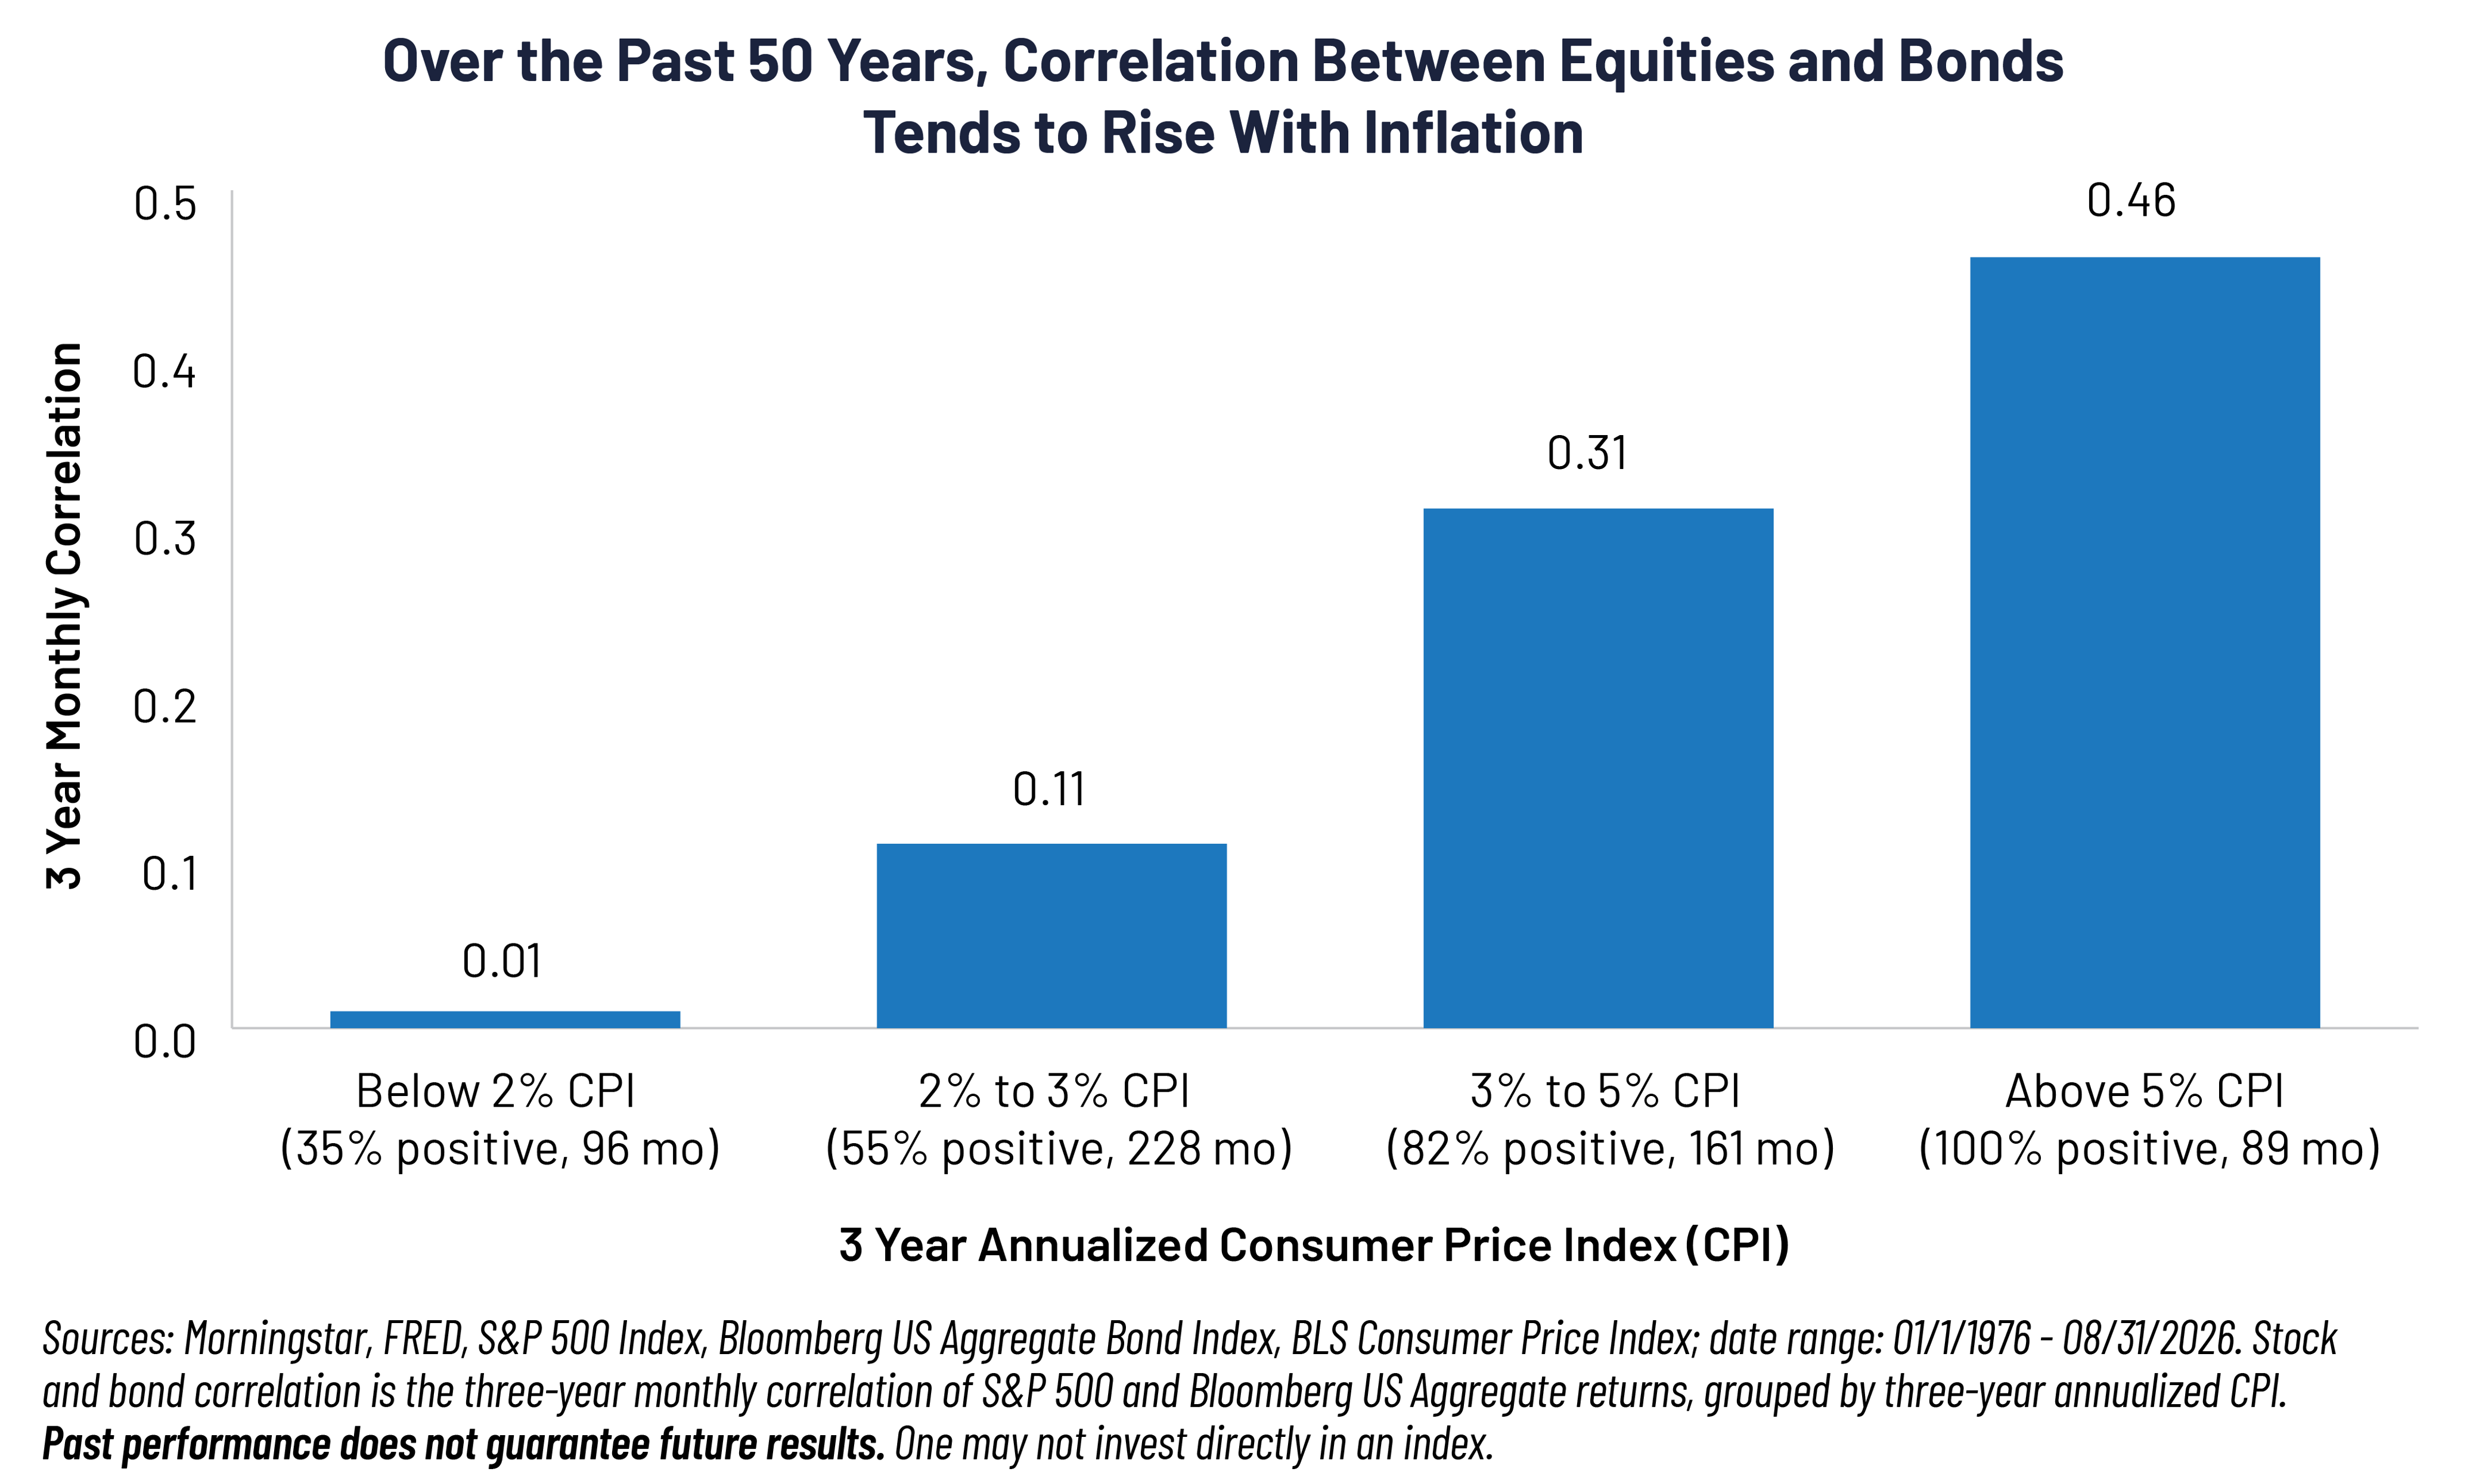 Bonds hedge stocks generally when growth is the bigger worry. With a slowing economy, investors buy bonds as stocks fall, and rates decline. When inflation rises or stays elevated, higher rates can hurt stocks and bonds at the same time. In 2022, stocks fell 18% and bonds fell 13%, the only year since 1976 both declined.
Where We Are Today
Over the past three years, inflation has averaged about 3%, which is between our 2% to 3% and 3% to 5% CPI ranges. As of 9/30/2026, the 36-month correlation between stocks and bonds is currently near 0.50, above the historical average for either range.1
Two key measures are pointing in opposite directions. The 24-month correlation has eased from 0.62 in late 2025 to about 0.30, hinting that the relationship may be loosening. Inflation, however, is moving the other way. CPI rose from 2.4% in January to 3.7% in September, and the 2-year Treasury yield climbed from 2.6% to 3.4%. If inflation maintains current levels, the three-year average could move into the 3% to 5% range over the next year, where bonds have historically been significantly more correlated with stocks.
Real Assets as Potential Diversifiers
If bonds can't be counted on to offset equity drawdowns, investors may desire other sources of diversification and real assets exhibit many compelling characteristics for consideration.
Investors face two key inflation risks, and they call for different exposures. The first is unexpected inflation, the surprise jump that markets haven't priced in. The second is persistent inflation, prices running higher for years and eroding real returns over time. An asset that protects against one may do little against the other.
We looked at several measures to frame how various real asset categories behave when stocks and bonds move together, and what each has earned over five-year periods of high inflation.
Risk 1: Unexpected Inflation
The chart illustrates how different real asset categories responded in a month with a one standard deviation inflation surprise, after removing normal stock and bond market moves. We used two measures. The CPI Surprise compares reported inflation with what markets expected the month before. The Citi Inflation Surprise Index compares inflation data releases with economists’ forecasts.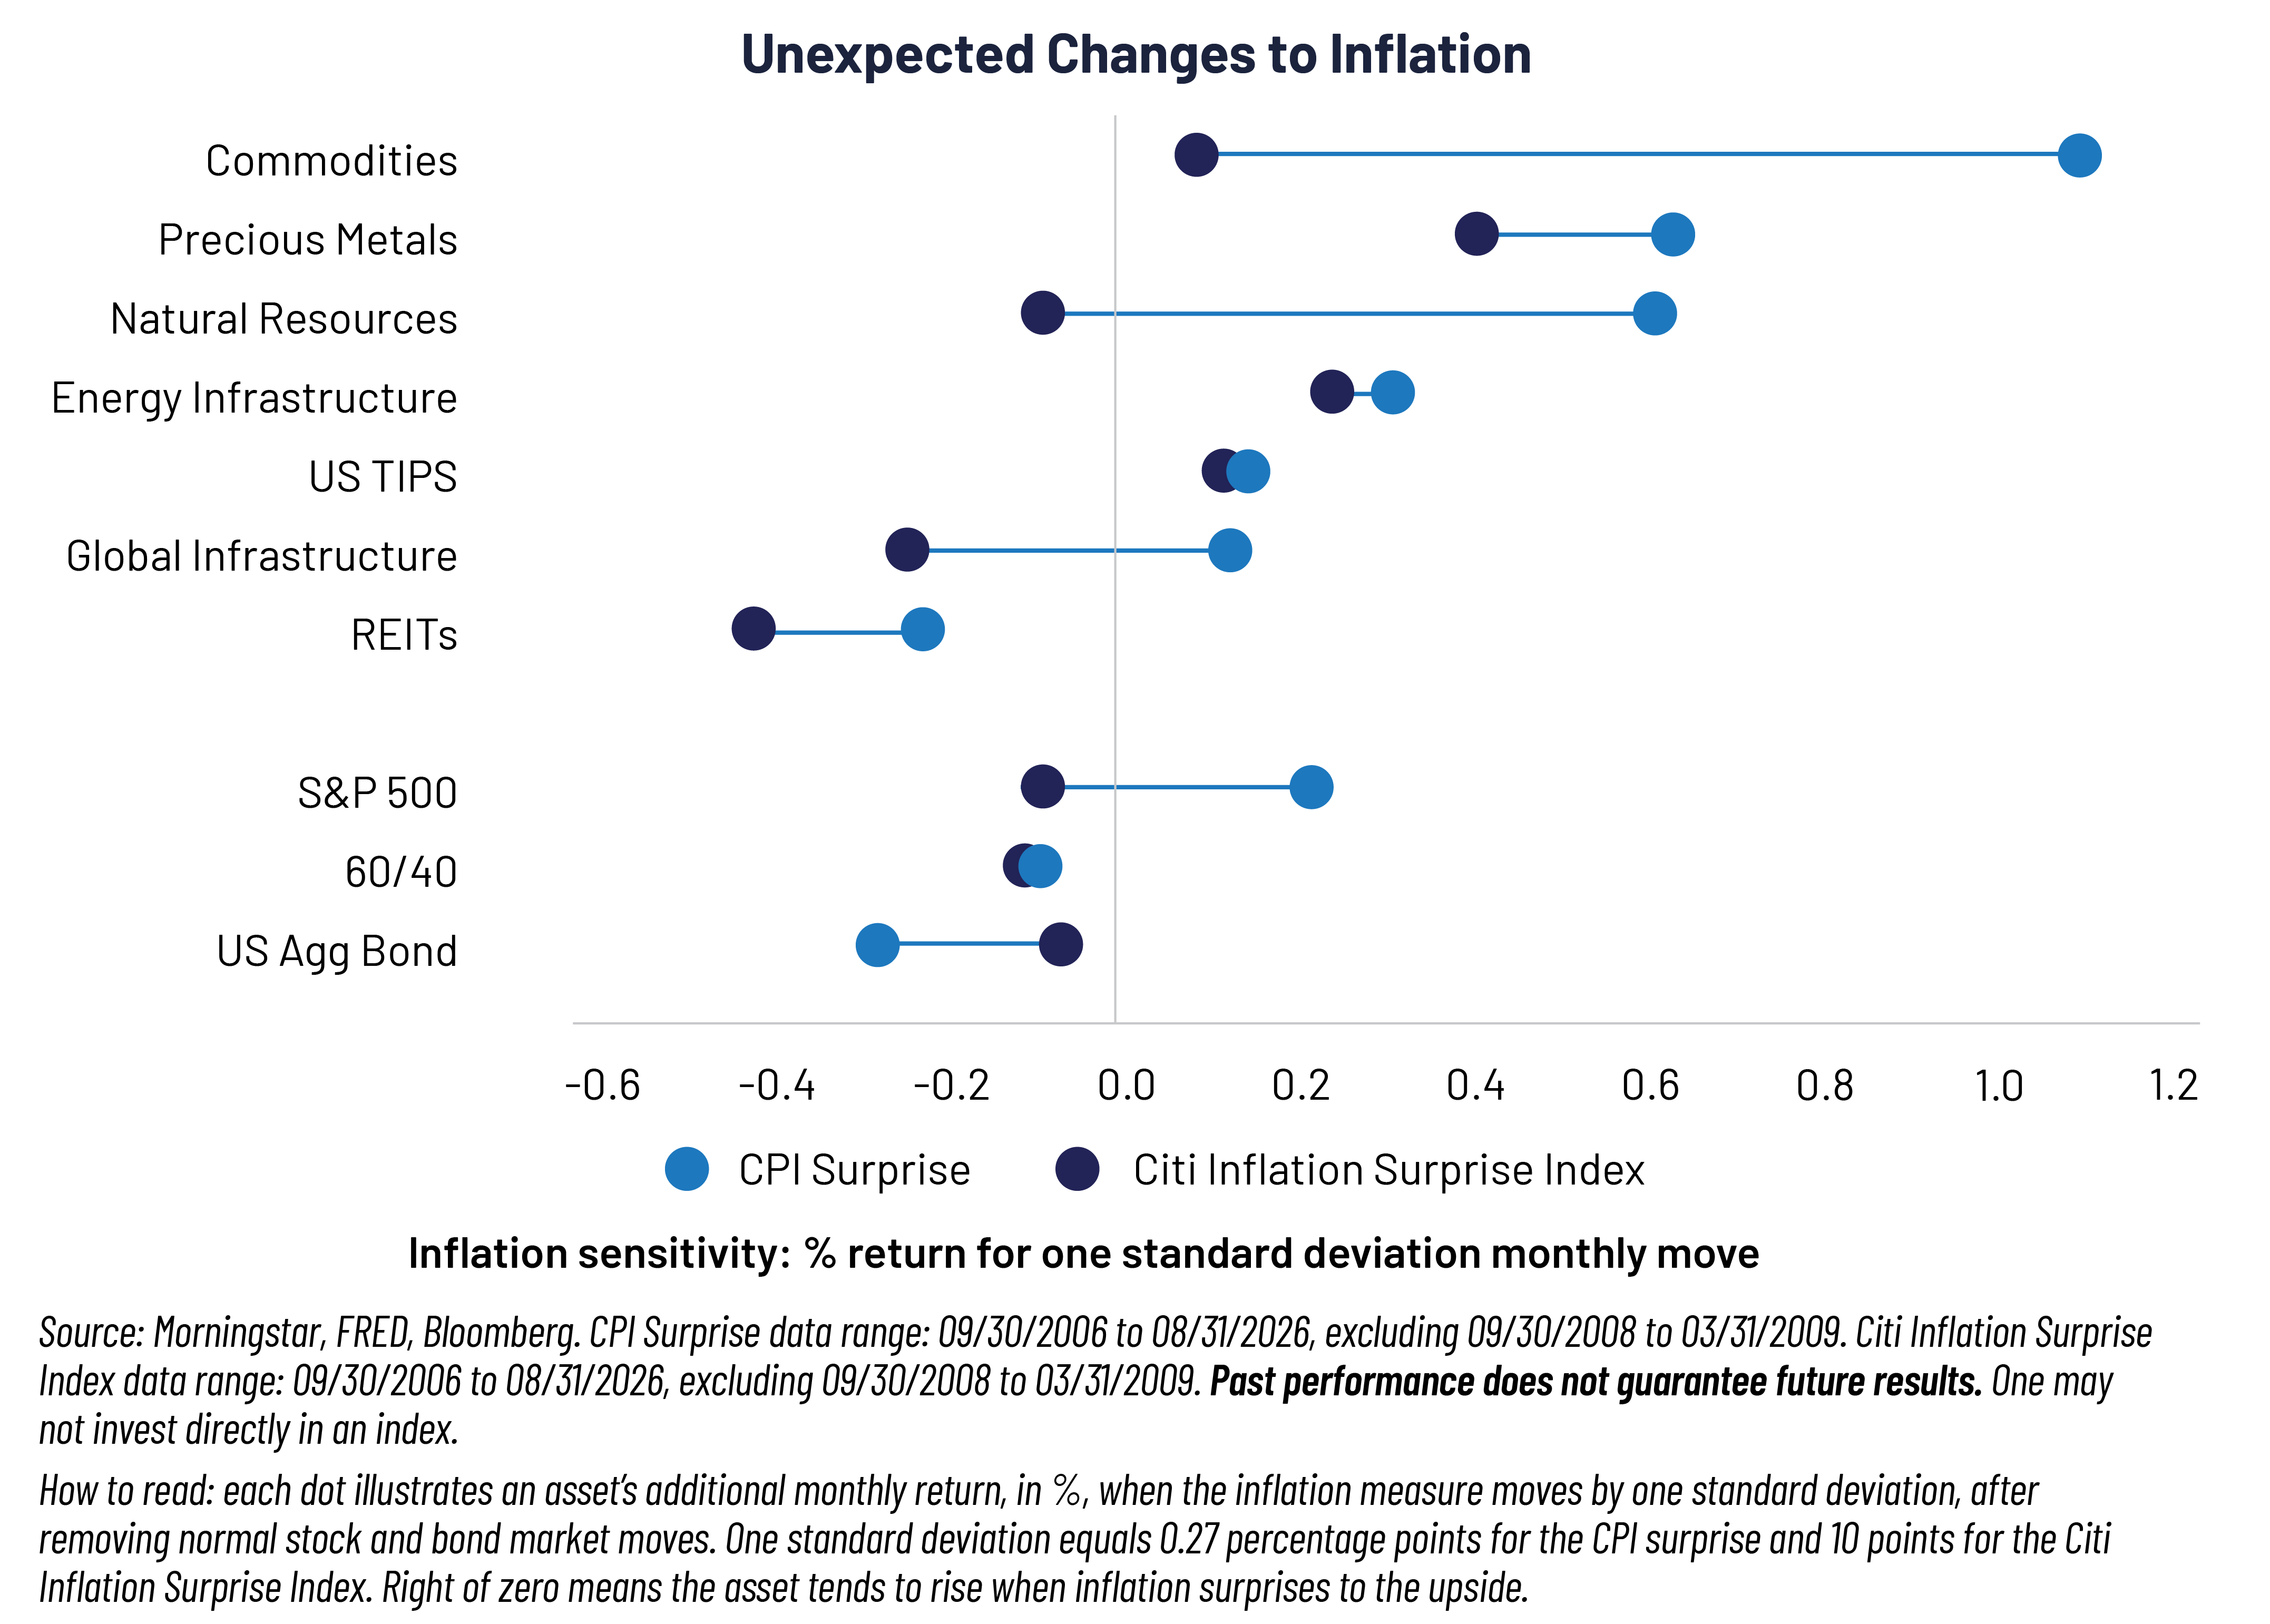 During episodes of unexpected inflation, commodities stood out. In a month when the CPI Surprise moved by one standard deviation (about 0.27 percentage points), they gained about 1.1%, the strongest and most reliable response of any asset we studied. Precious metals and natural resources also responded, though less consistently. Natural resources tended to give back their gains the following month.
Core bonds moved the other way, losing about 0.3% on a one standard deviation surprise while real estate investment trusts (REITS) and infrastructure showed little or no protection from unexpected inflation.
Risk 2: Persistent Inflation
Over longer periods, different assets outperformed. When inflation averaged above 3% over five years, core bonds earned just 3.1% a year after inflation, trailing every asset except Treasury Inflation-Protected Securities (TIPS). Energy Infrastructure earned 10.3%, Natural Resources 8.5%, REITs 7.5%, Global Infrastructure 5.9% and Commodities 5.2%.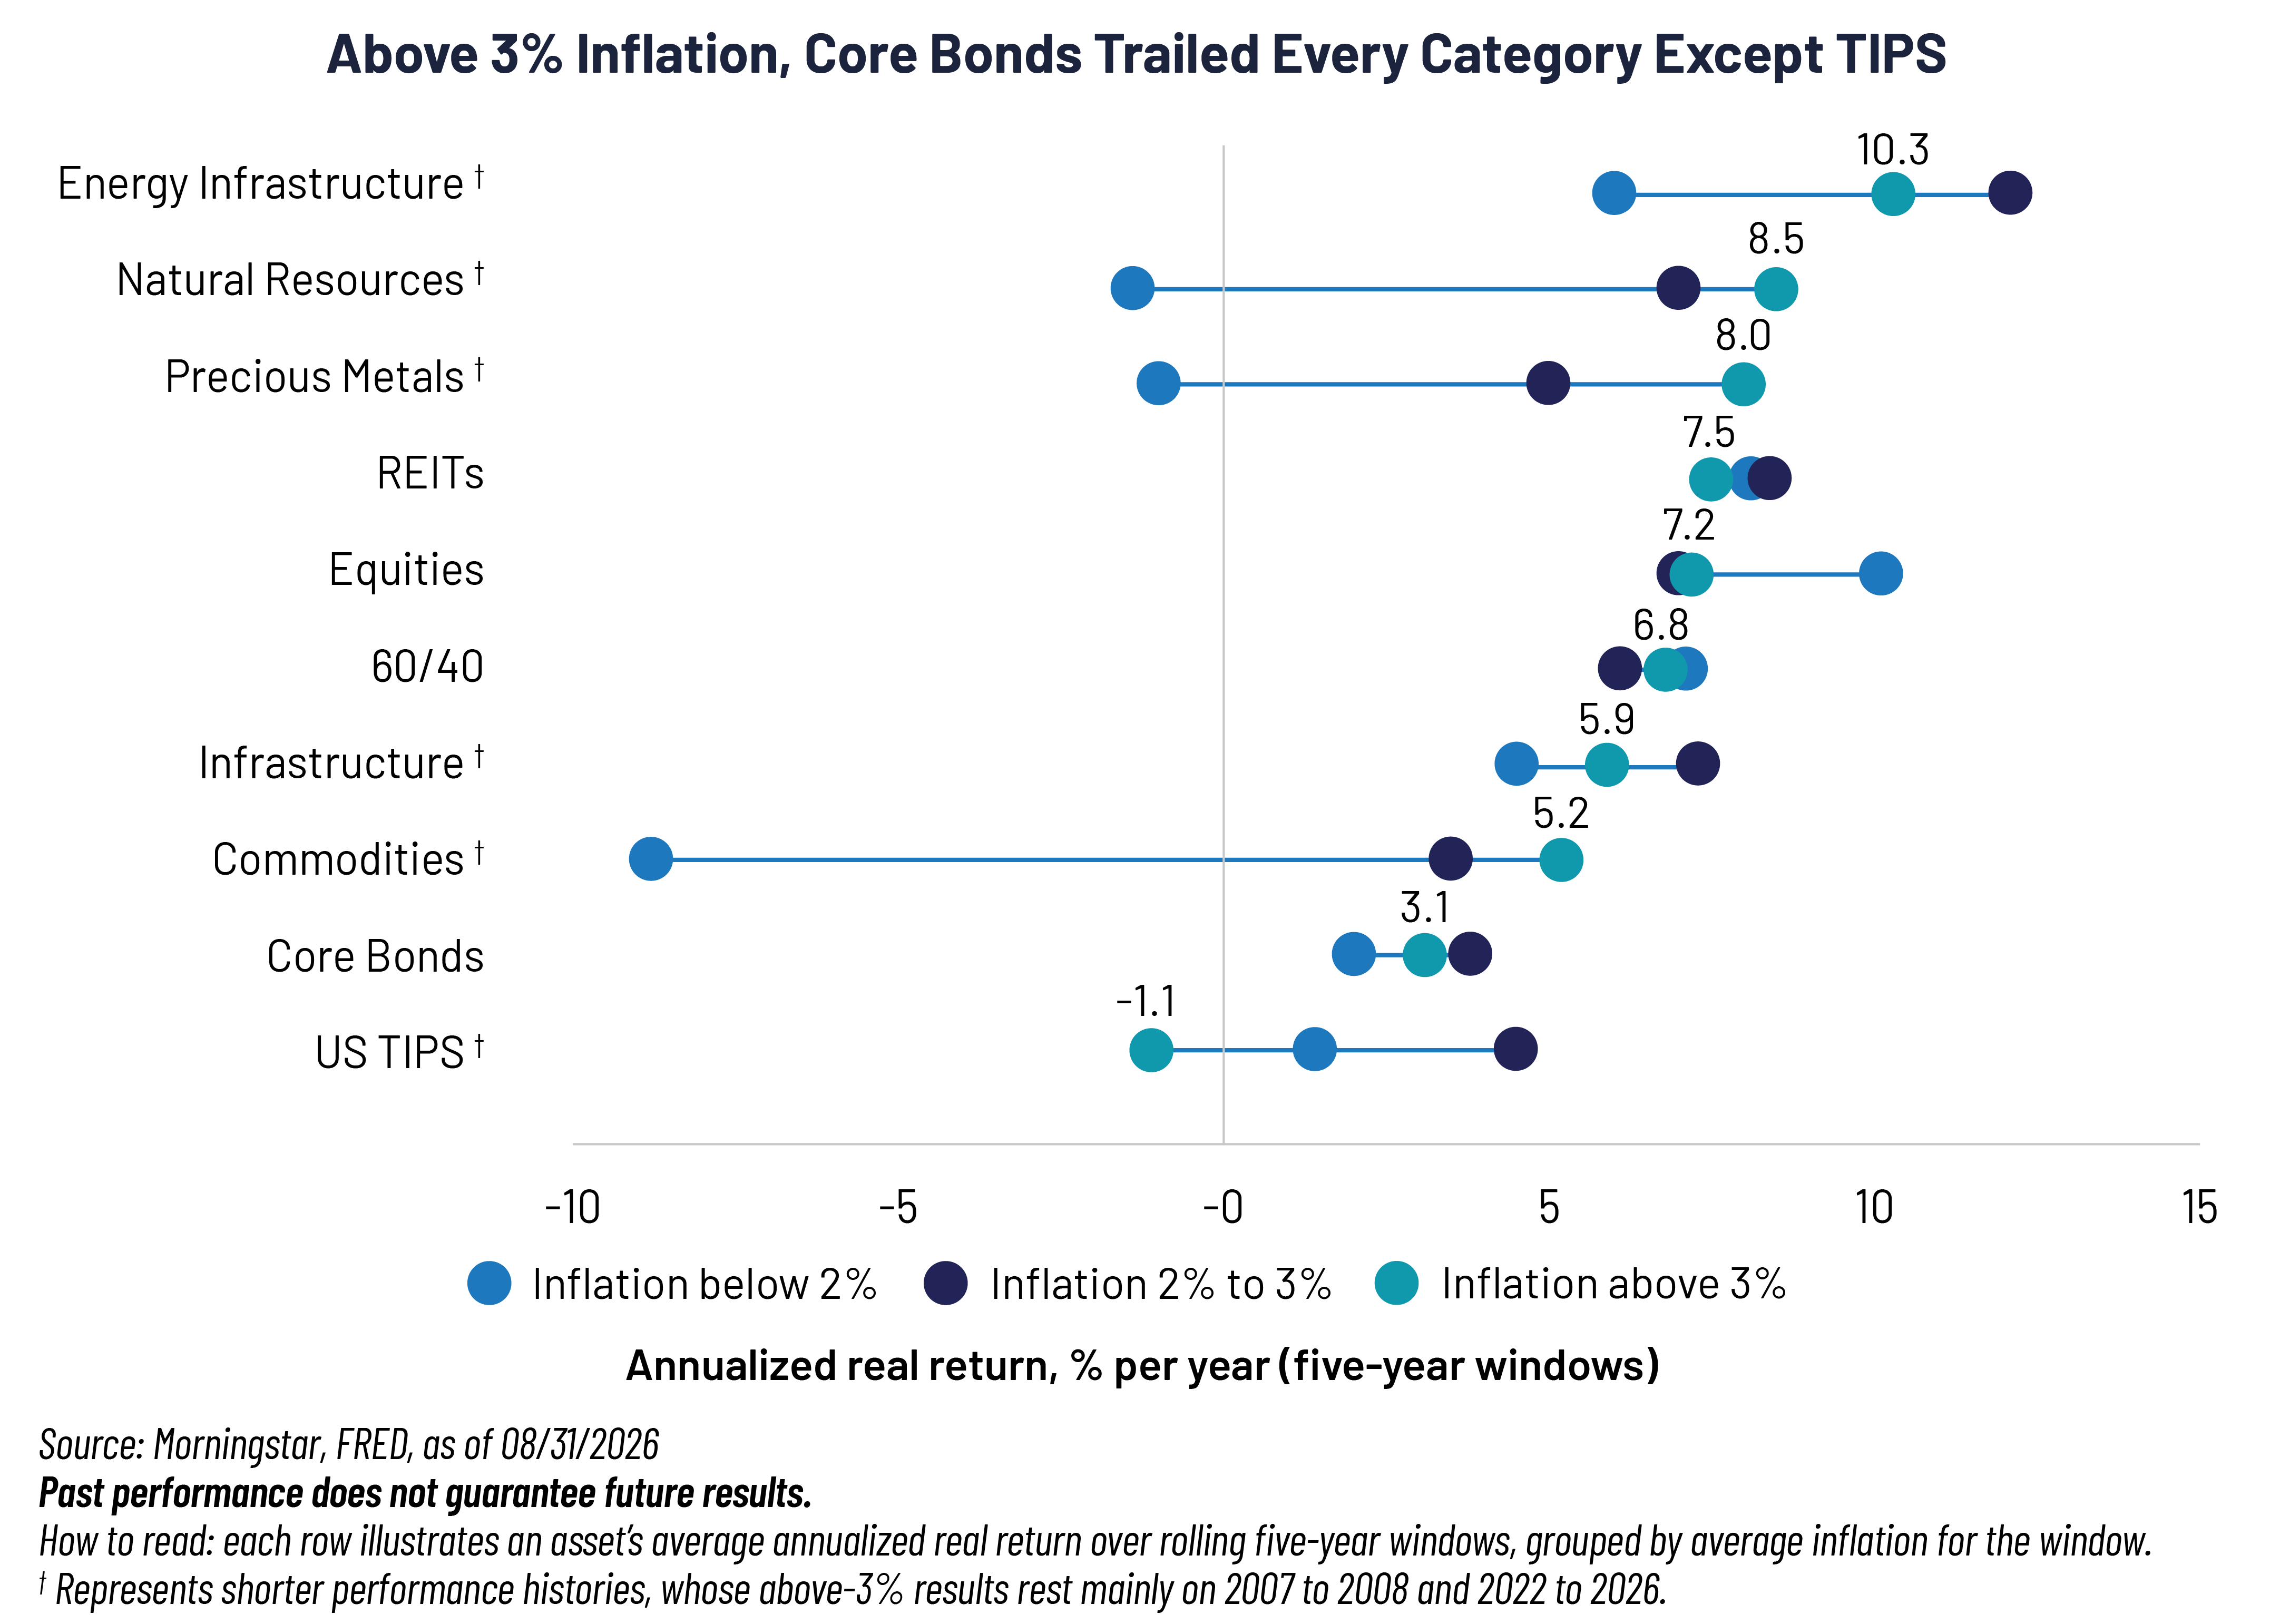 REITs sharply illustrate the difference between the two risks. They offer two return sources: rental income, which they must largely pay out as dividends, and growth, as rents and property values adjust over time. Both tend to lag an inflation surprise but catch up as inflation persists.
Commodities show the opposite pattern. They are the best short-term hedge, but they lost 8.8% a year when inflation ran below 2%.
Implementation Approaches: Insurance (unexpected inflation) and Real Growth (higher persistent inflation)
Because the two risks behave differently, consider real assets as two sleeves with different jobs.
-
An insurance sleeve for unexpected inflation. Consider commodities, precious metals, and natural resources as key allocations. Like insurance, they pay off when inflation surprises but cost when it doesn't with funding from bonds where the bulk of inflation risk resides.
-
A real growth sleeve for persistent inflation. REITs, energy infrastructure, global infrastructure and natural resources aim to grow real wealth over full inflation cycles. They carry equity-like risk, so they typically sit alongside the equity allocation.
-
Consider TIPS within the bond sleeve. TIPS protect against inflation relative to nominal bonds, though they lost value when real yields rose sharply in 2022.
-
Monitor the inflation cycle. The insurance sleeve tends to pay off early in an inflation surge, and the growth sleeve later. Rebalancing from the first into the second after a surge can position portfolio to address both risk profiles.
-
Equity concentration is additional concern beyond bond’s inflation problem. Equity market leadership has narrowed recently, with a small group of large companies driving much of the S&P 500 Index’s return. Real assets draw on different return drivers, such as commodity prices, property rents, and contracted or regulated cash flows. Several also pay meaningful income, including REITs and infrastructure. Together, those traits can broaden a portfolio’s sources of return beyond what stocks and bonds alone provide.
-
Additional diversifiers can improve outcomes, but don’t abandon bonds. Bonds generally provide protection for both recession and growth shocks. During past cycles, after inflation cools, the stock-bond correlation has generally fallen to around zero or below.
Conclusion
The 60/40 is still a sound framework, but as inflation rises, its central assumption that bonds will offset stocks, becomes less reliable. Real assets, used as insurance against inflation surprises and as a source of real growth when inflation persists, can help diversify portfolios in exactly the conditions where bonds fall short.
Important Disclosures & Definitions

1 Morningstar, as of 09/30/2026

CPI Surprise: the monthly change in seasonally adjusted CPI minus the inflation the Cleveland Fed expected for that month. A positive value means prices rose faster than expected.

Citi Inflation Surprise Index: a Citigroup score of how US inflation releases compared with economists’ forecasts, smoothed over recent releases. It is built from data releases, not market prices.

S&P 500 Index: widely regarded as the best single gauge of large-cap US equities. The index includes 500 leading companies and covers approximately 80% of available market capitalization.

AAI001257