

 Tracking Earlier Observations
Was May a regime or a coincidence? Back then, we observed that Health Care and Consumer Staples (staples) were trading close to the mirror image of the AI complex, and suggested tilting concentrated clients' completion sleeves toward them, inside a tracking-error budget, and with a rule to unwind if the relationship faded.
It didn't fade. If anything, it got stronger. Over the past 16 years the 126-day correlation between the health care and technology sector ETFs has had a median of +0.71, and it had never dipped below zero before this year. Today it sits at −0.39, and staples is at −0.59 (see Exhibit 2). Since May 5, health care is up 32%, while a core AI basket is down 2% and the S&P 500 Index is up 7%.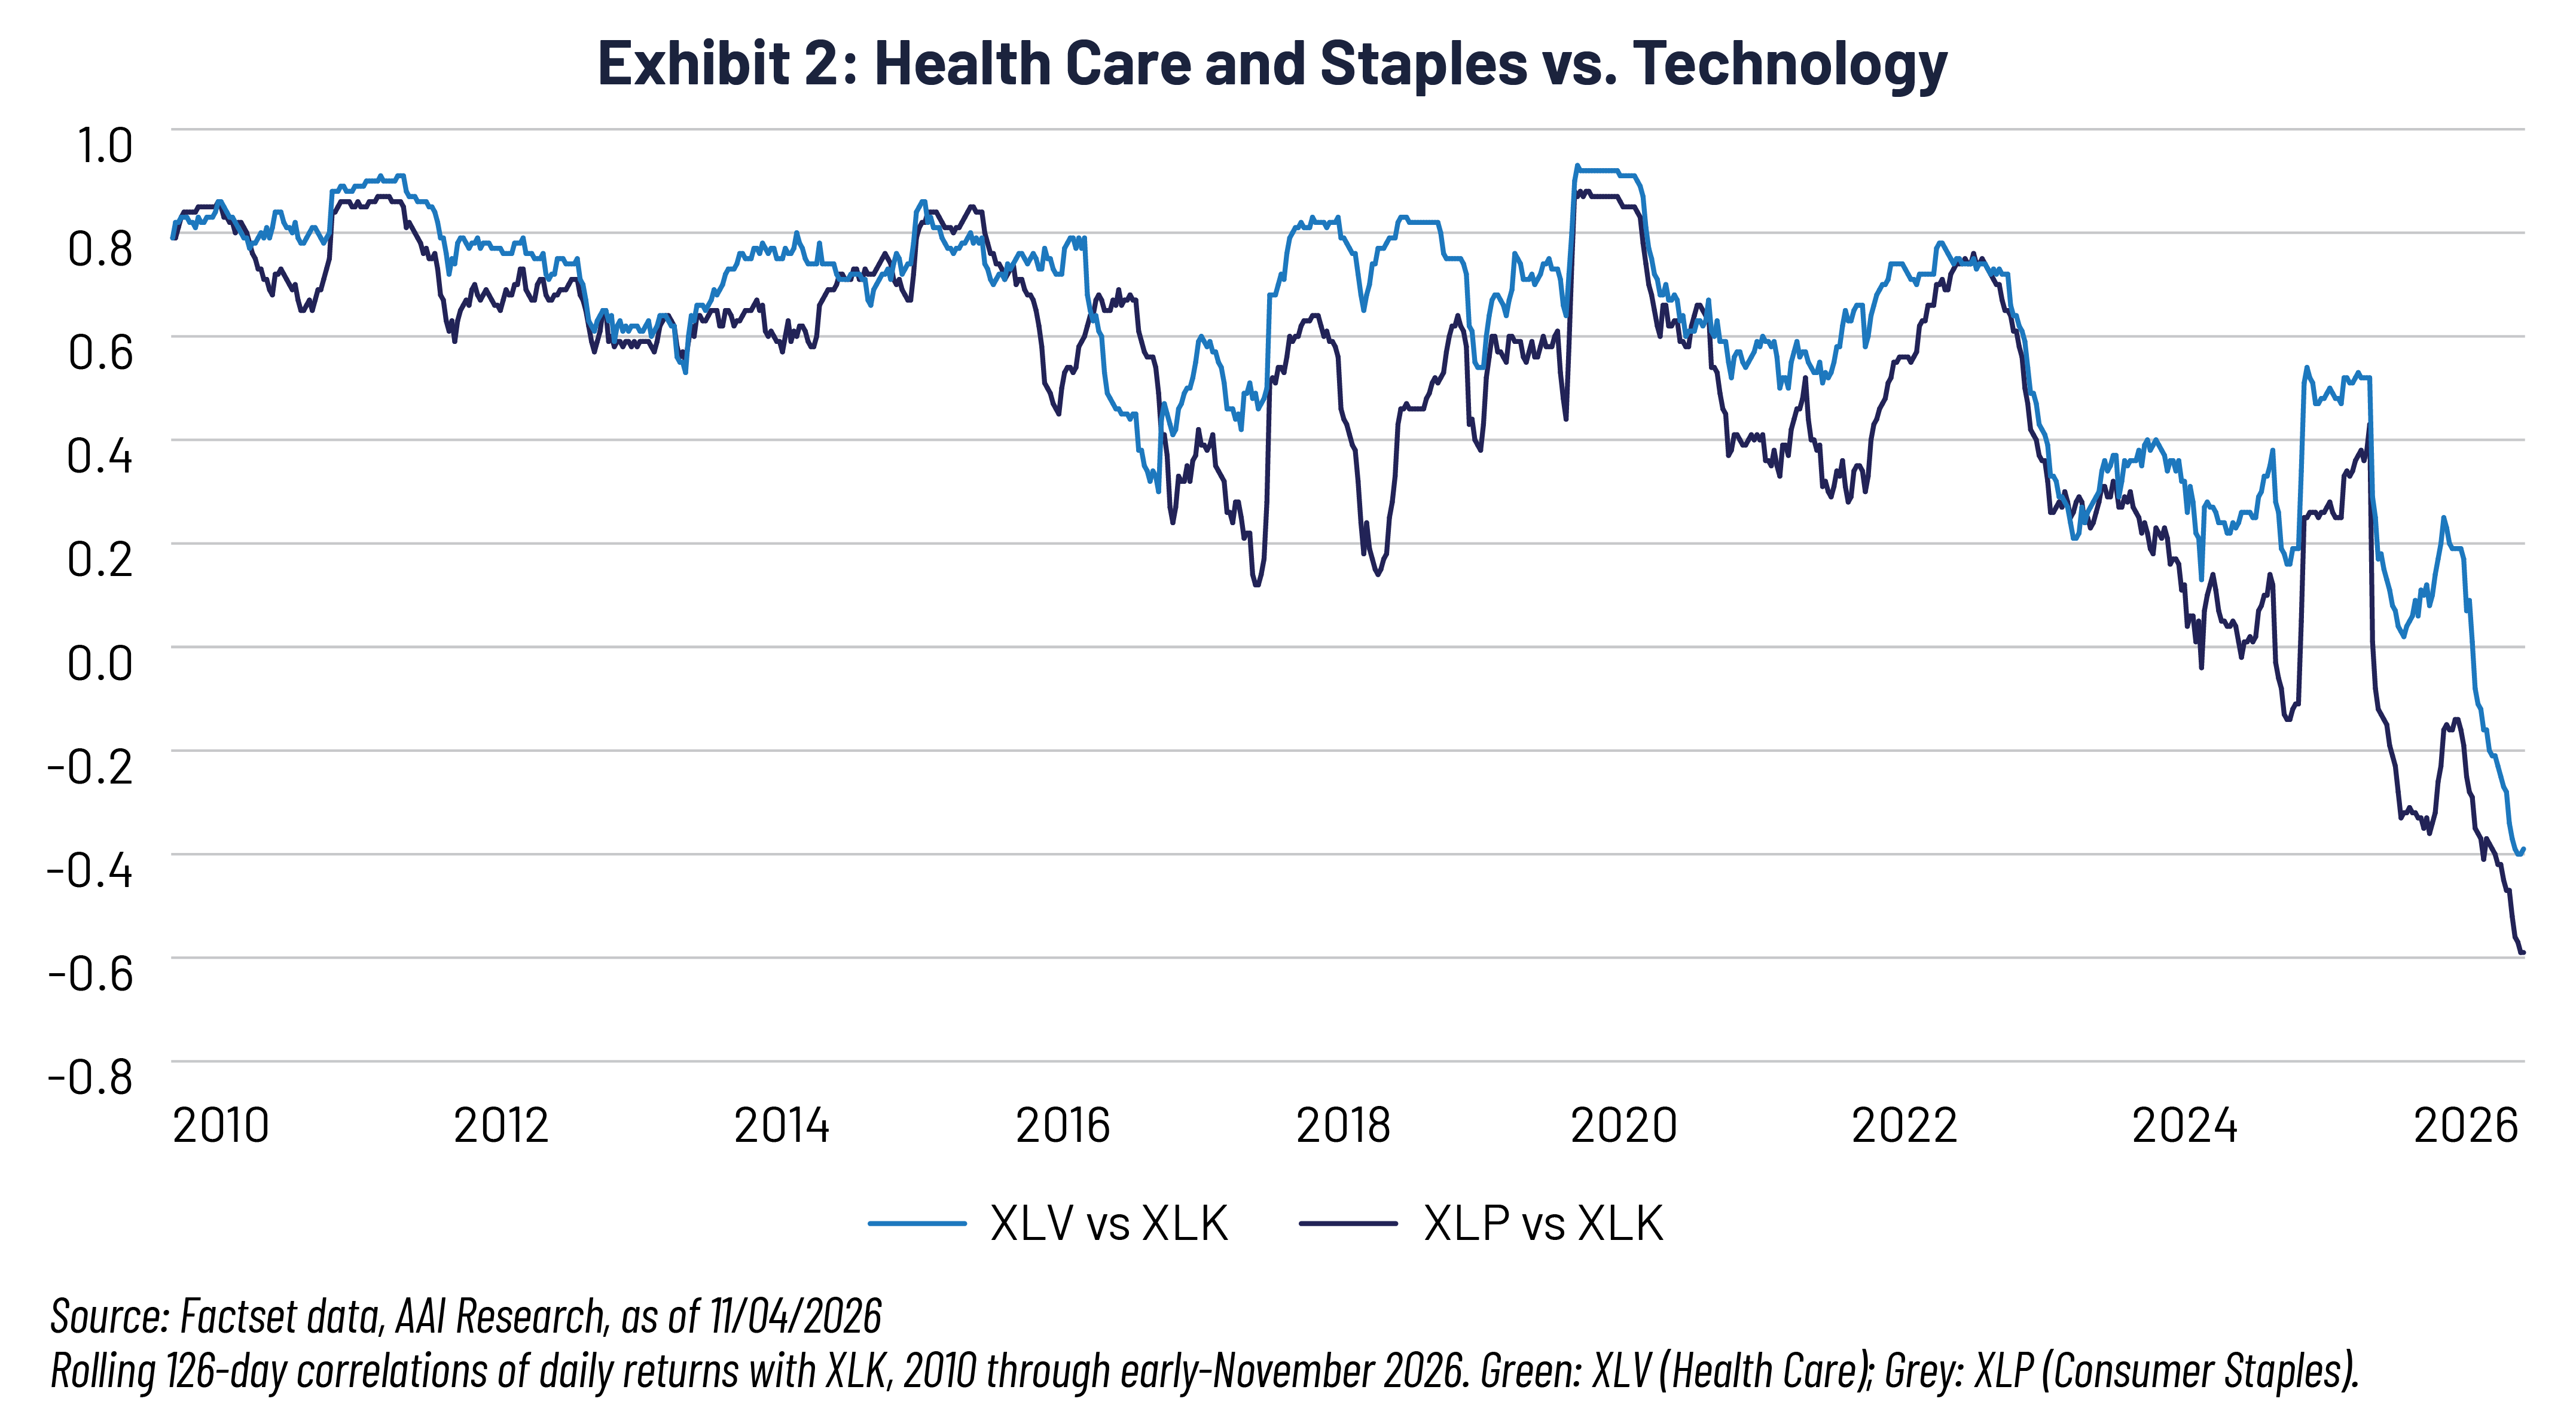 October was the real test. Technology fell 8.3% and the S&P 500 slipped 0.9%, while health care rose 9.8% and staples 10.9%. On the worst tenth of AI days since May, staples averaged +1.9% and health care +1.1%, up from +0.6% and +0.2%, respectively, in the year before. Health care had its own catalysts, and thirteen bad days isn't much of a sample. Still, the correlation structure told us ahead of time how a concentrated household would hold up, and a benchmark-neutral sleeve ignores that.
Did it Hold Up Out of Sample?
To test the idea without hindsight, we set up a household portfolio that is 60% concentrated in artificial intelligence—equally weighted across Nvidia Corp. (NVDA), Microsoft Corp. (MSFT), Broadcom Inc. (AVGO), Meta Platforms Inc. (META), Amazon.com Inc. (AMZN), and Alphabet Inc. (GOOGL)—and 40% in a completion sleeve. Using only data through May 5, we picked the 15 names with the lowest measured AI exposure, blended them with the index, and left everything alone (see Exhibit 3):
-
Variance. A 25% tilt took household volatility down from 19.1% to 17.6%, at a cost of 5.5% of tracking error in the sleeve. The drop in variance was 1.7 times the squared tracking error, i.e., the covariance term did the heavy lifting, as we argued in May. The household lost 4.8% in October rather than 5.7%.
-
Loss timing. The tilted sleeve's losing weeks increasingly lined up with weeks when the concentration was rising, exactly when a client wants to trim: 18% with no tilt, 27% at 25%, and 67% at 50%. The harvested losses showed up when there were gains to offset.
-
Diminishing returns. At a 50% tilt the variance ratio slipped below 1. The first few points of tracking error buy most of the benefit.
Exhibit 3: Out-of-Sample Household Results
| Tilt to Low-AI Basket | Household Volatility | Sleeve Tracking Error | Sleeve Corr. to AI Holding | Household, Avg. Worst AI Day |
| 0% | 19.1% | 0.0% | 0.80 | -1.81% |
| 25% | 17.6% | 5.5% | 0.64 | -1.58% |
| 50% | 16.4% | 10.9% | 0.28 | -1.34% |
Source: Factset data, AAI Research, 05/06/2026 - 11/04/2026
Sleeve tilt chosen on data through May 5. Hypothetical, before fees and taxes.
Contextual Concentrations
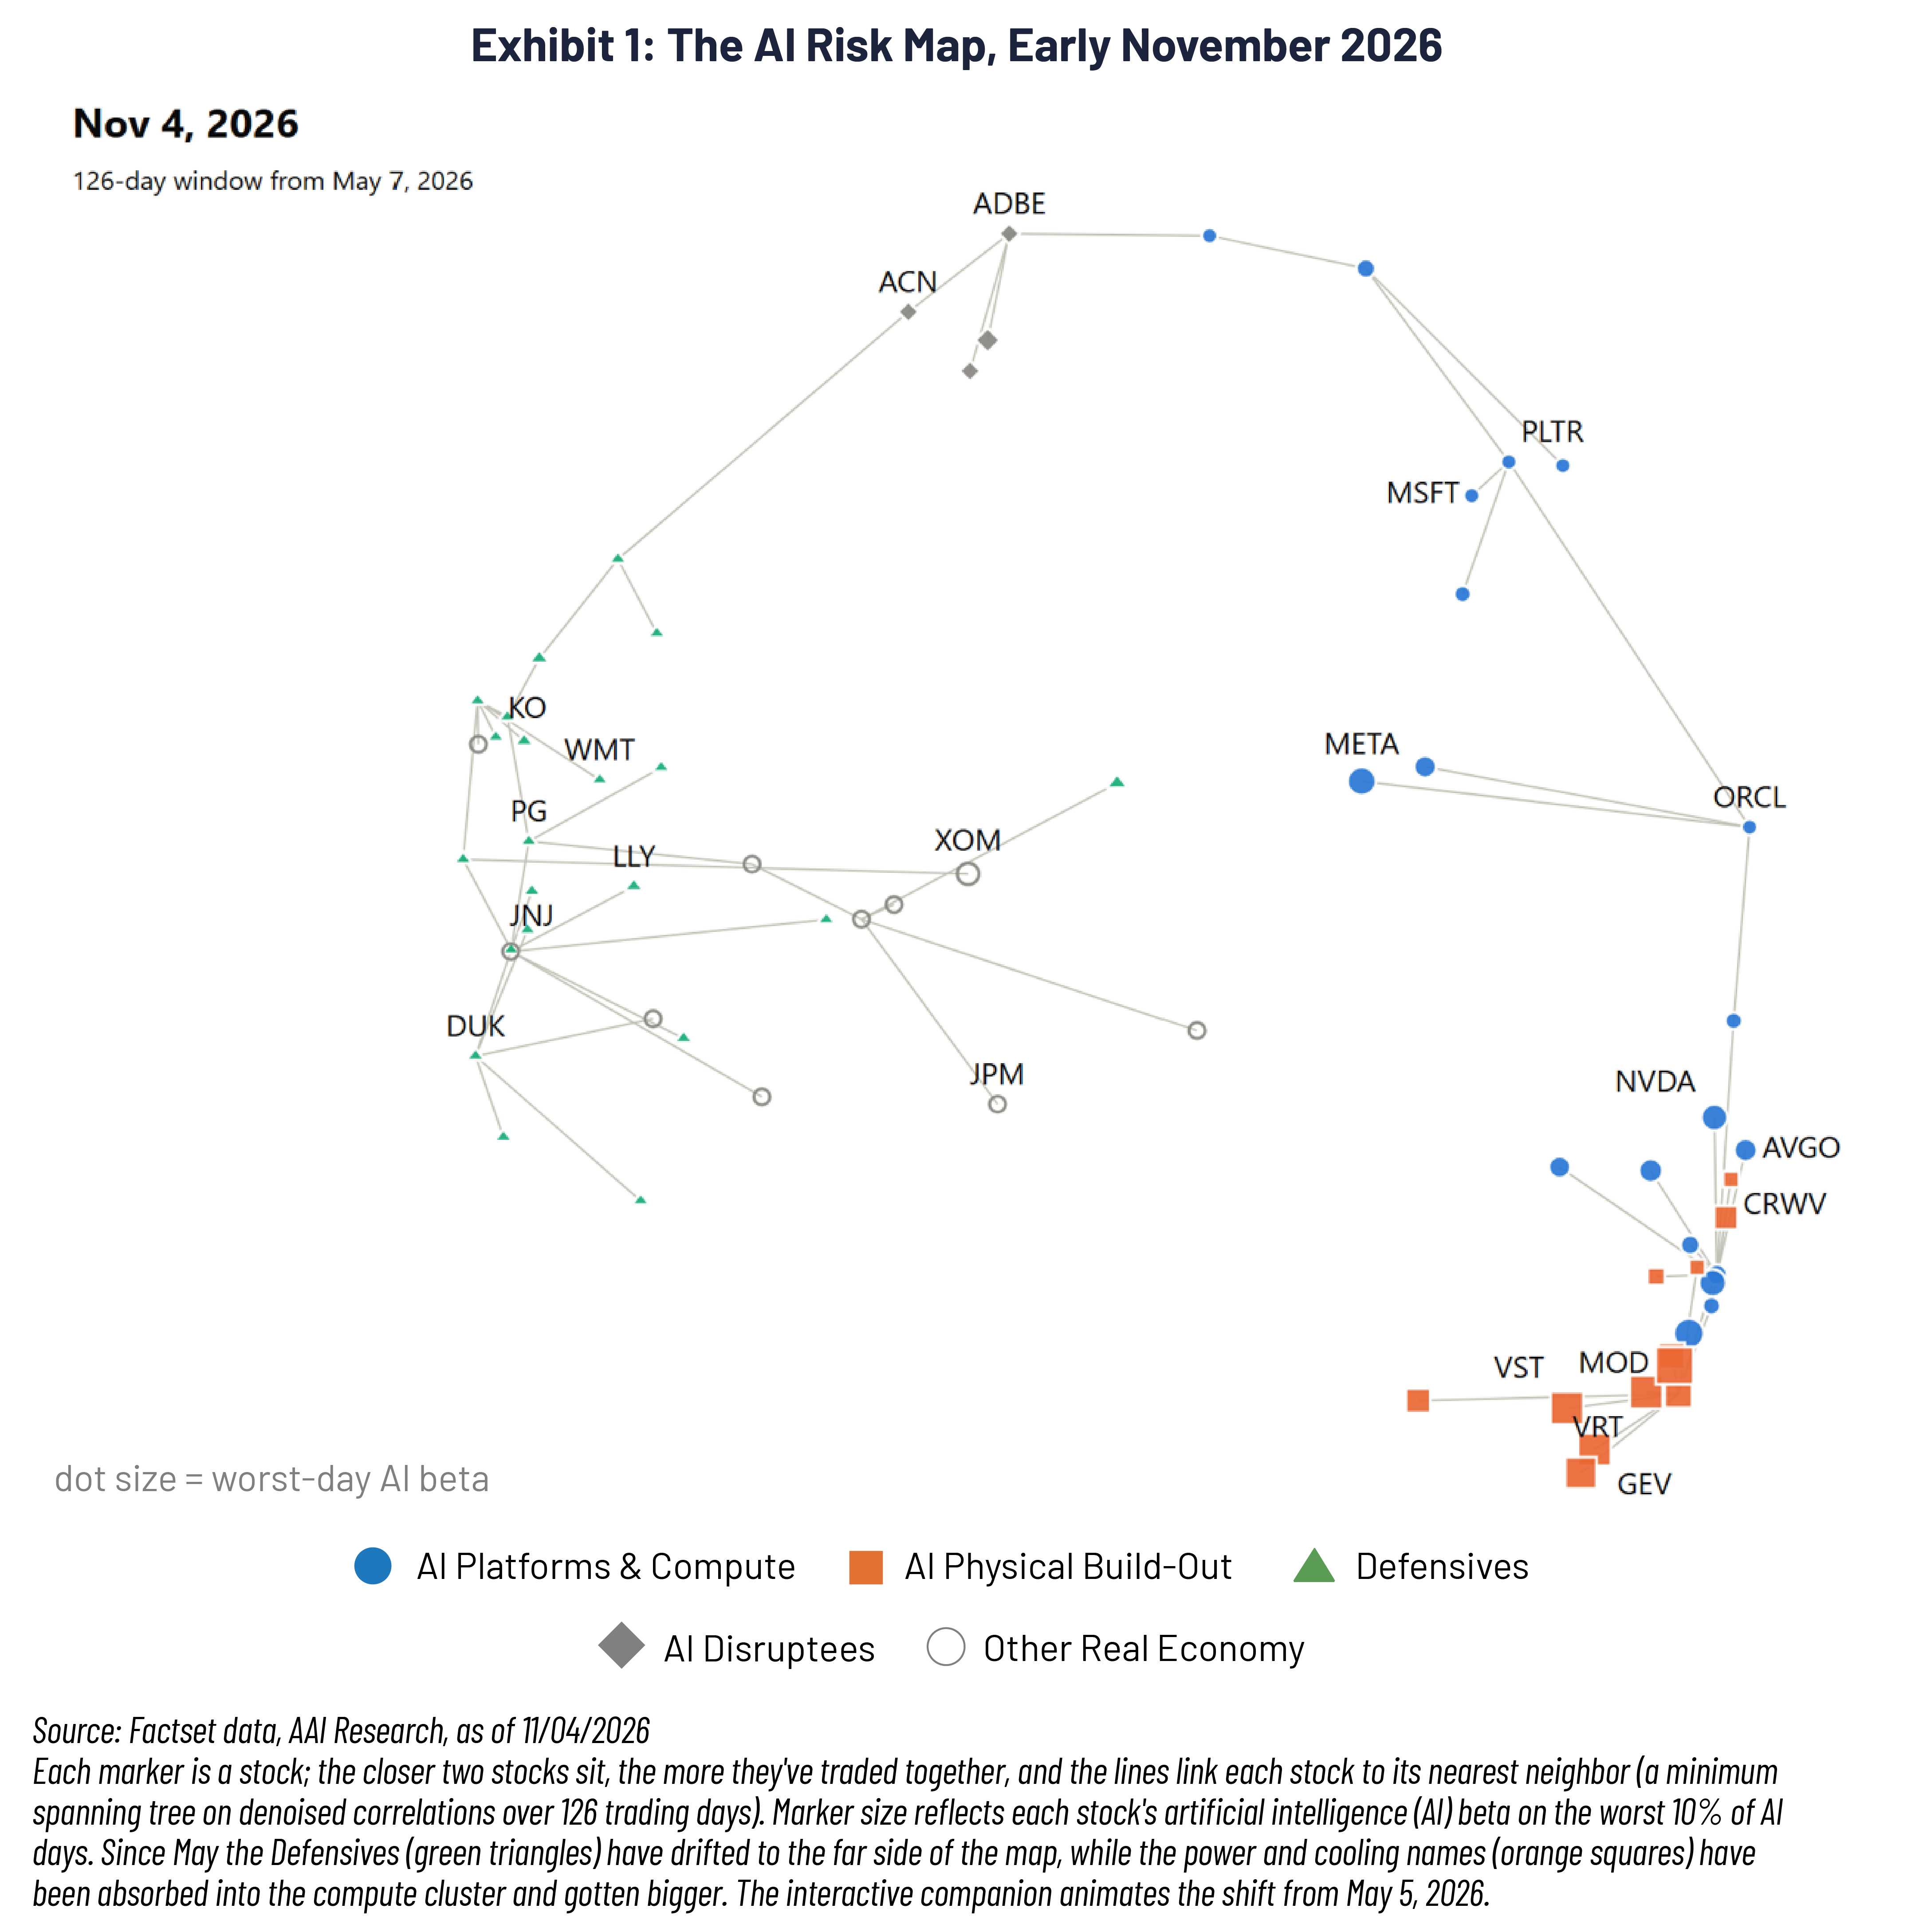
Power, cooling, and grid names carry industrial and utility sector labels, but they haven't been trading like it (see Exhibit 1). Since May their AI beta has averaged 1.5, a touch above the chip makers, and on the factor's worst days it's been 3.4, up from 1.0 the year before. From November 2 to 4, Modine fell 24%, Vistra 13%, and Vertiv 12%. The bottom line is that a sleeve diversified by sector label can add AI risk while appearing to take it away (see Exhibit 4).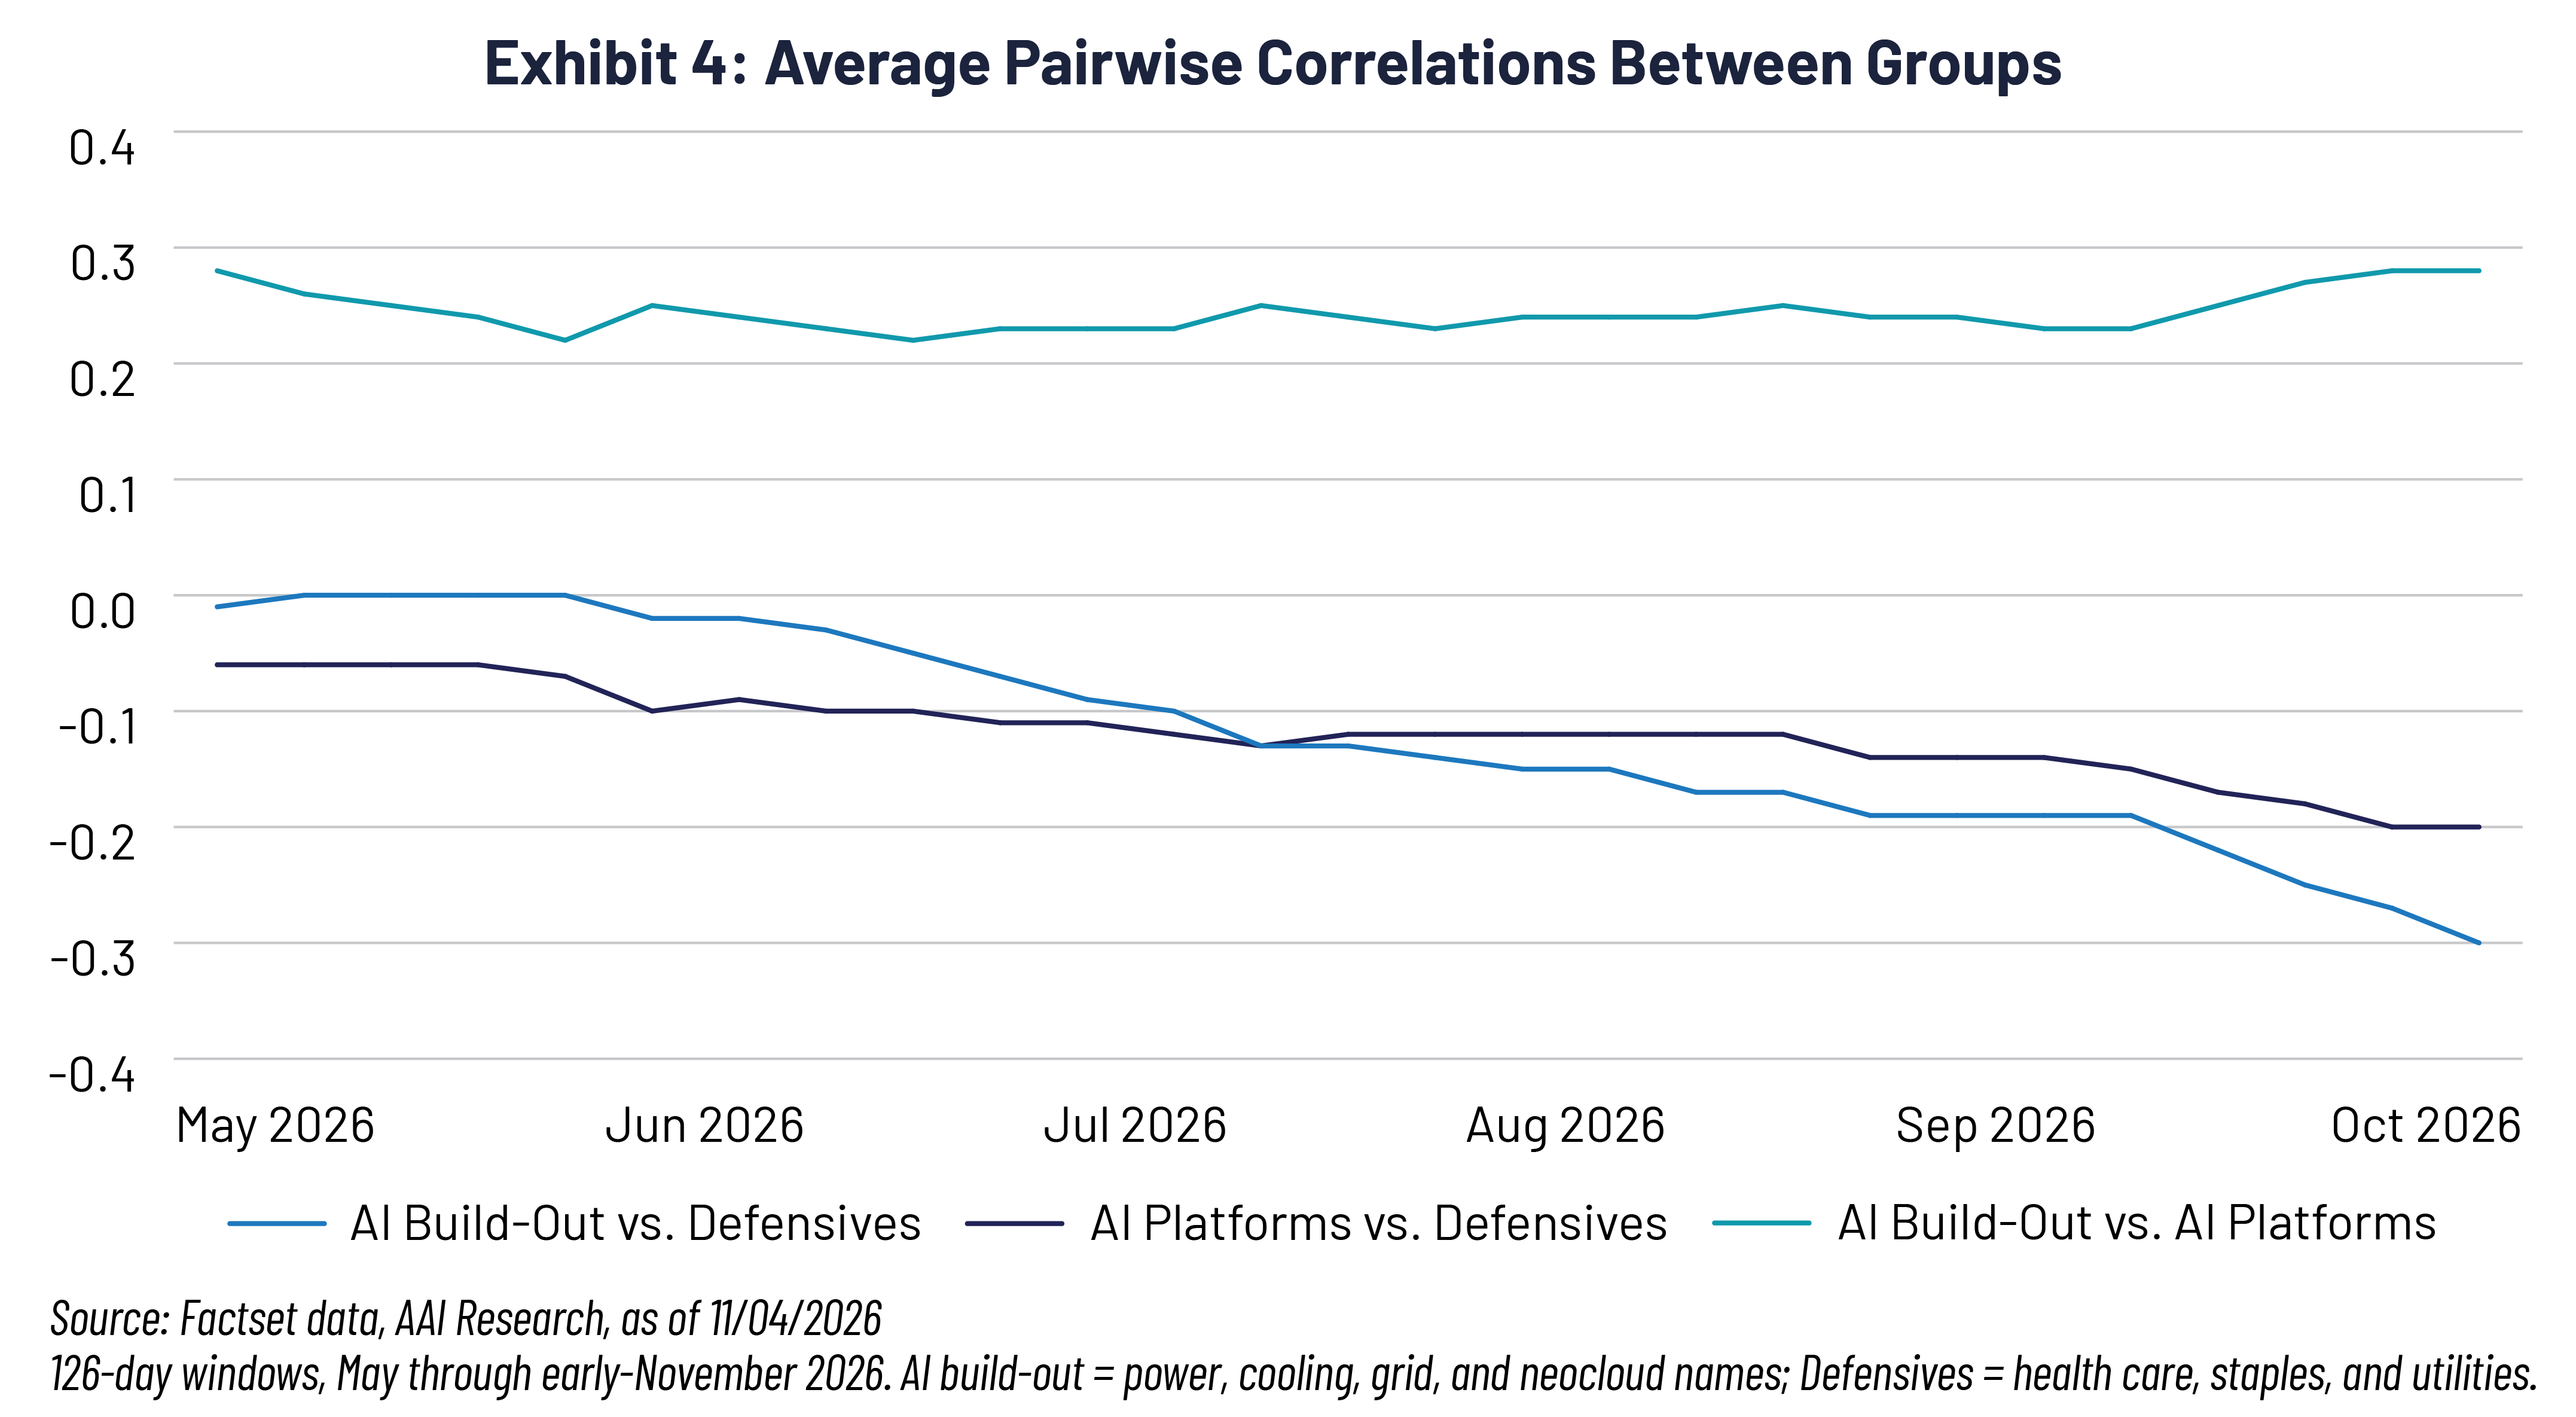 As an alternative to sector labels, we can measure exposure directly: each stock's beta to a pure AI factor (a core AI basket stripped of market, rate, and oil effects), its beta on the factor's worst days, and clusters from the denoised correlation matrix. The measurements look durable, with a 0.89 rank correlation between AI betas estimated in May and in November. We leave out the businesses AI threatens to displace. They had the best returns of any group on the worst AI days, which makes them more of a hedge on AI than a diversifier from it.
Limitations
The AI trade is now the market's largest factor. The first eigenvalue of our 66-stock correlation matrix explains 31% of the variance, up from 19% in May, and its eigenvector is essentially the spread between the AI Stocks and the Defensives, uncorrelated with the equally-weighted market. That means a long-only sleeve can lower a household's AI beta, but it can't make it negative. The tilt has also had a big run, which is when the unwind rule matters most; we review it quarterly against the rolling AI-to-sleeve correlation and Hyperscaler capital expenditure (Capex) guidance. And a sleeve funded with new cash dilutes the concentration over years, a path clients should see alongside the after-tax cost of selling.
May's conclusion still stands. The completion portfolio is where the platform can do its most useful work for a concentrated client, and it should be built from what the correlation matrix is saying rather than from sector labels.
Important Disclosures & Definitions

Capital Expenditures (CAPEX/Capex/CapEx): refers to investments in physical assets such as plant and machinery.

S&P 500 Index: widely regarded as the best single gauge of large-cap US equities. The index includes 500 leading companies and covers approximately 80% of available market capitalization. One may not invest directly in an index.

AAI001281